XRP is trading at $3.14 to $3.16 over the past 60 minutes with a market cap of around $187 billion and a 24-hour trading volume of $7.47 billion. The intraday price has fluctuated between $3.12 and $3.32, indicating a narrow trading range amid broader technical signals.
 Jamie Redman
XRP
The 1-hour chart reveals XRP is in a short-term downtrend, retreating from $3.331 to $3.12. The chart is characterized by strong bearish candles and modest recovery attempts, highlighting weakening intraday bullish momentum. Immediate support is located at $3.12, a critical level that, if breached, may pave the way for a decline toward $3.00.
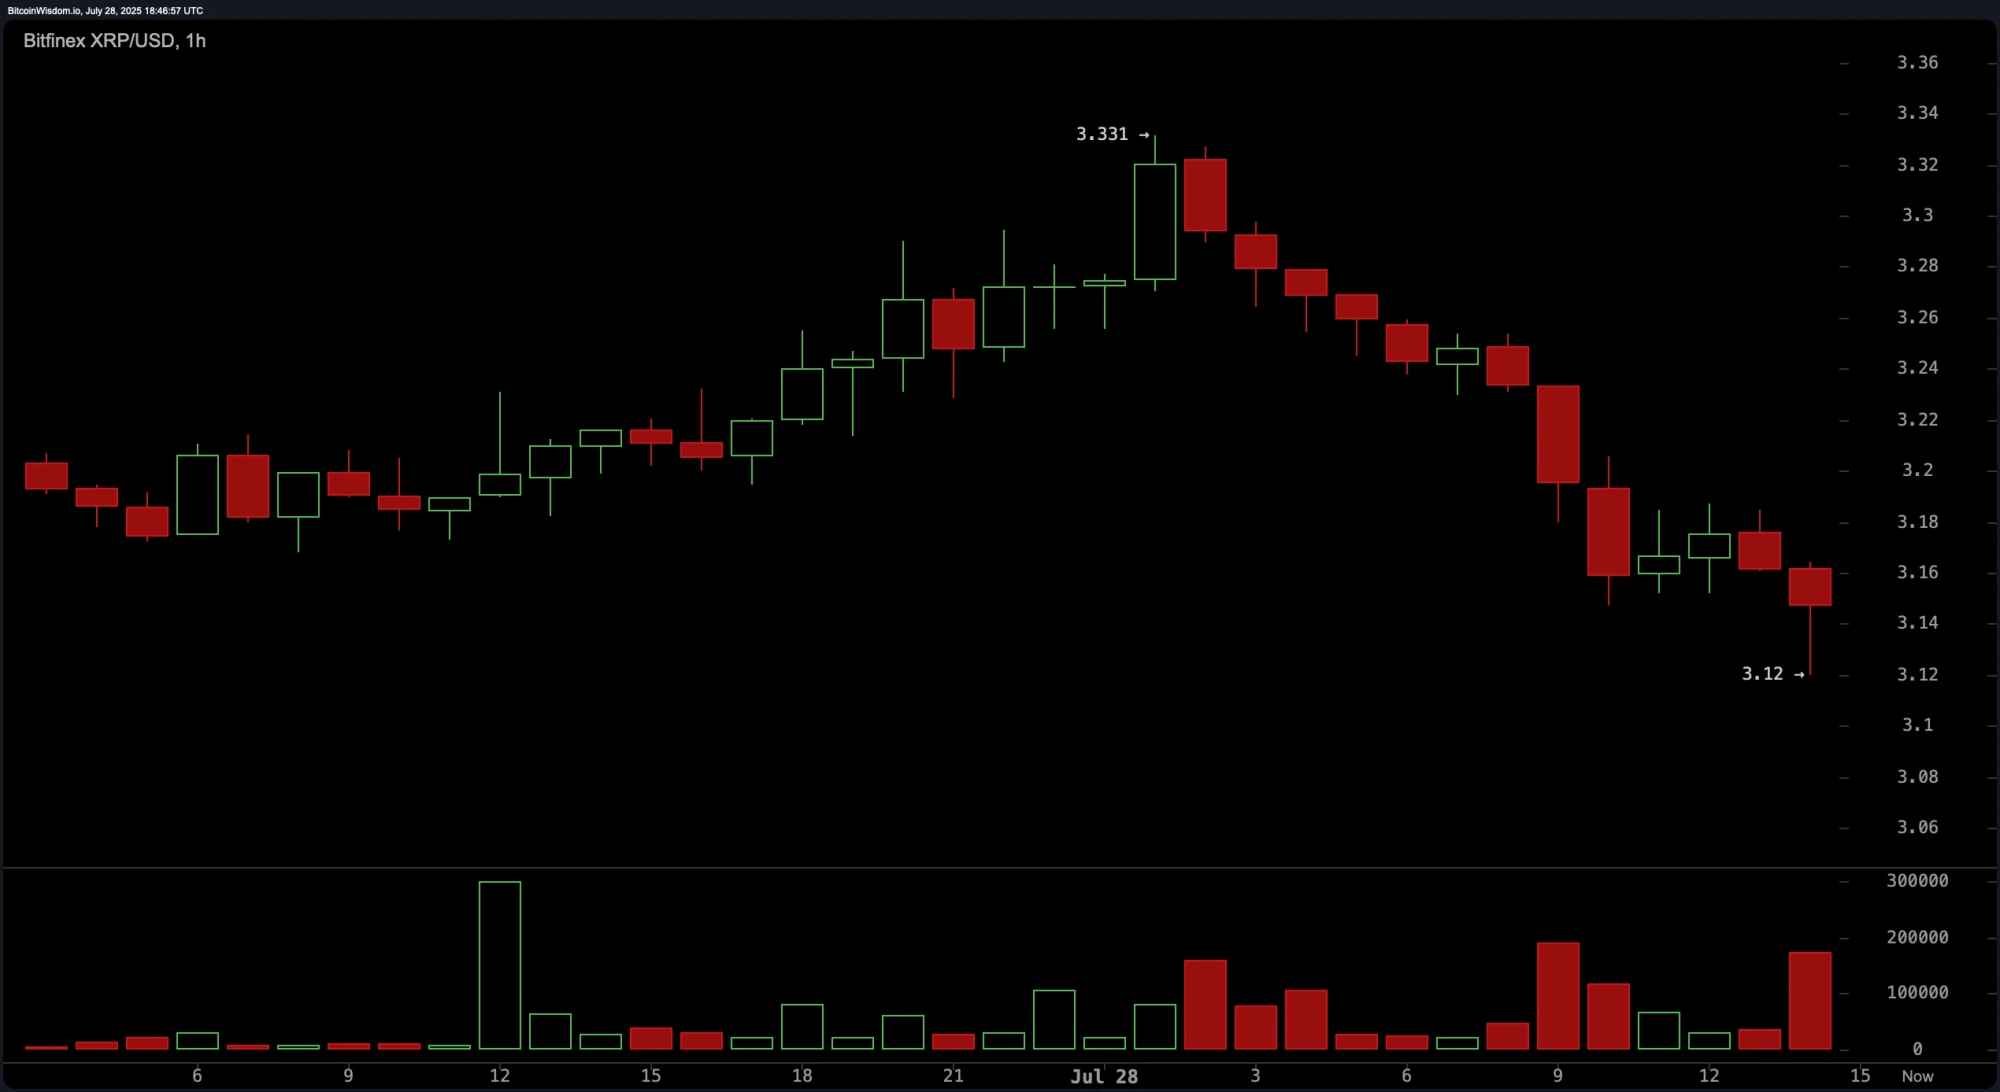 XRP/USD 1-hour chart via Bitfinex on July 28, 2025.
On the 4-hour chart, XRP maintains a bearish stance, with price action declining from $3.55 to a low of $2.96 before staging a mild recovery. The $3.30$3.35 zone has consistently acted as resistance, with repeated rejections suggesting strong overhead supply. Volume analysis supports a bearish narrative, with sellers dominating recent sessions. Minor support at $3.10 and $3.00 may provide temporary relief, but a convincing break below these levels would likely signal further downside.
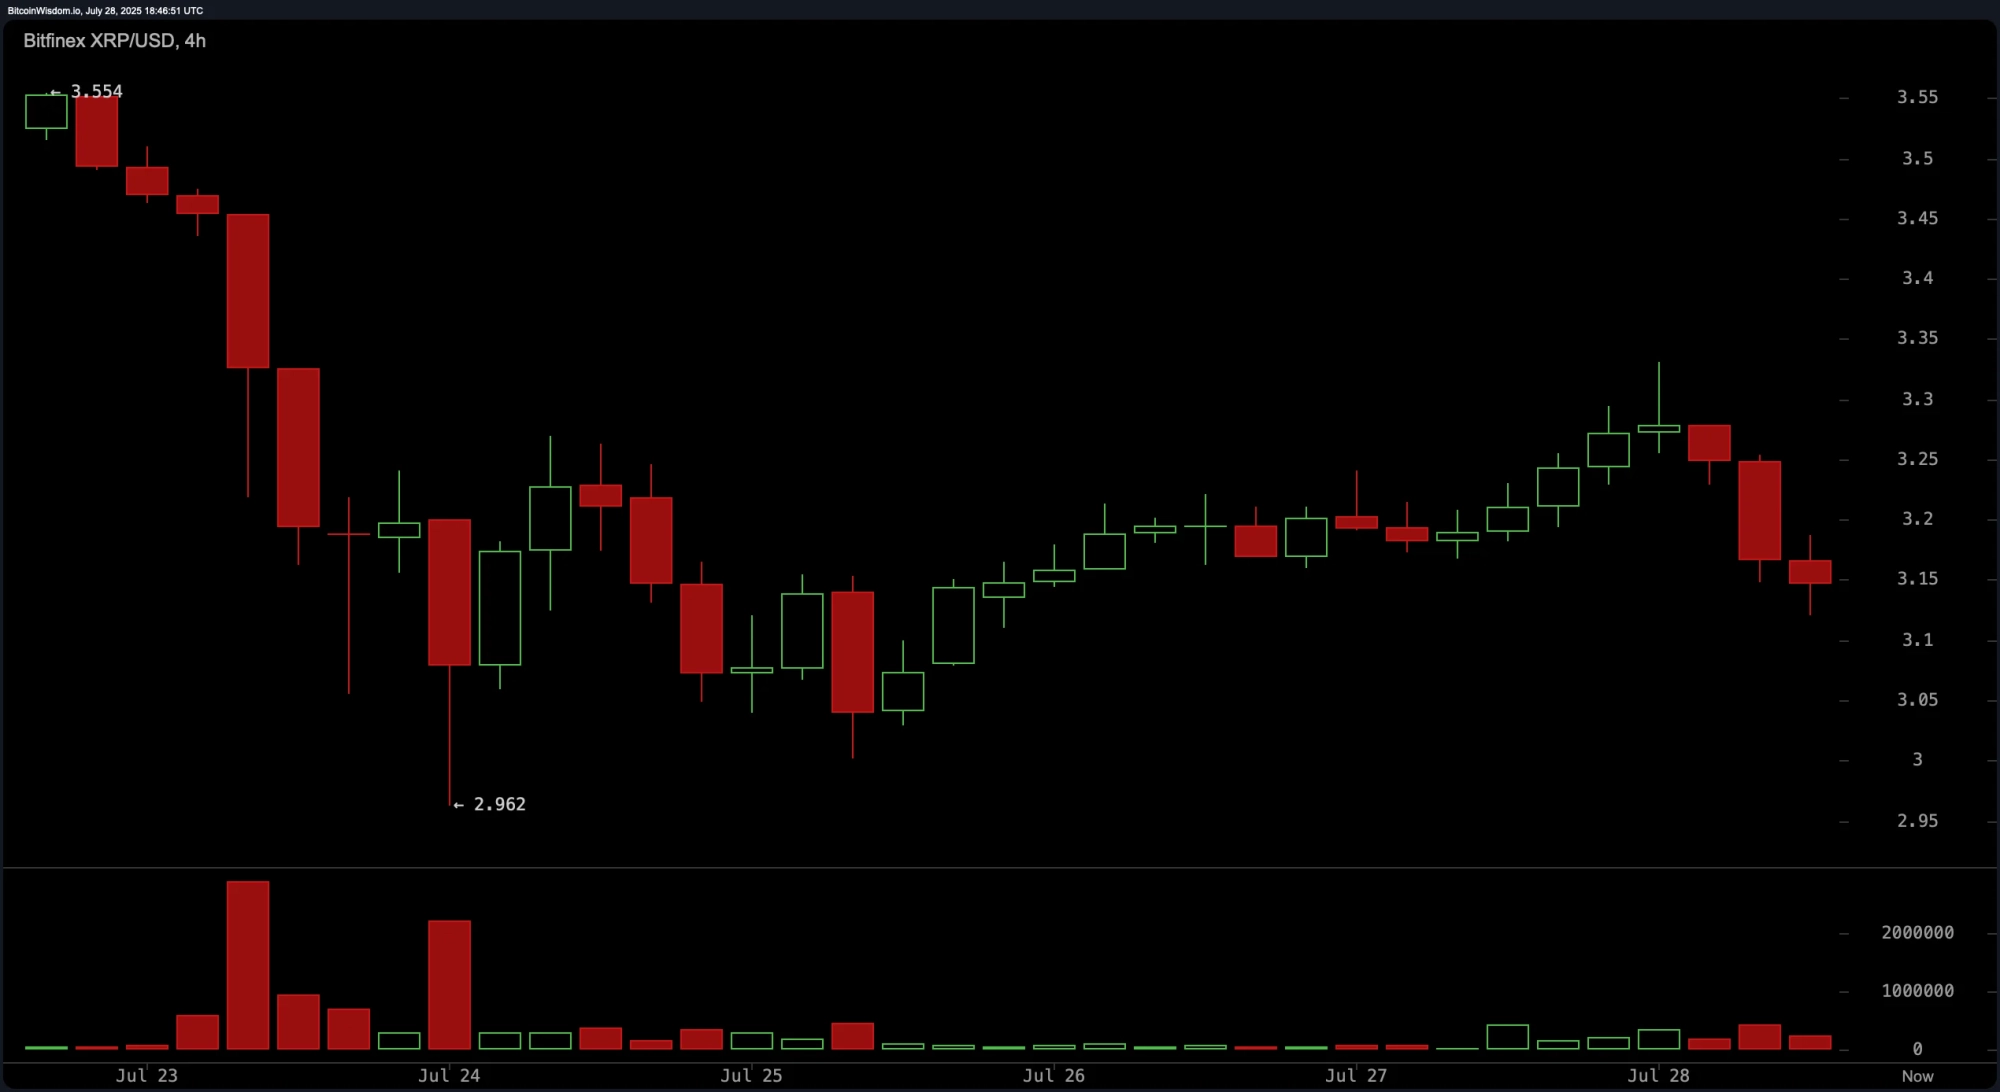 XRP/USD 4-hour chart via Bitfinex on July 28, 2025.
The daily chart shows a broader uptrend extending from approximately $2.00 to a recent high of $3.661, although this has been followed by a sharp correction. Increased volume at the peak could indicate a distribution phase, while the emergence of a bearish engulfing pattern and subsequent red candles point to ongoing selling pressure. Currently, XRP is consolidating within the $3.15$3.30 band, hovering above key support at $3.00$3.10. Resistance levels are located at $3.50 and $3.66. Bullish confirmation via a breakout above $3.35, accompanied by strong volume, is essential for any optimistic outlook. A failure to hold $3.00 may lead to a breakdown scenario.
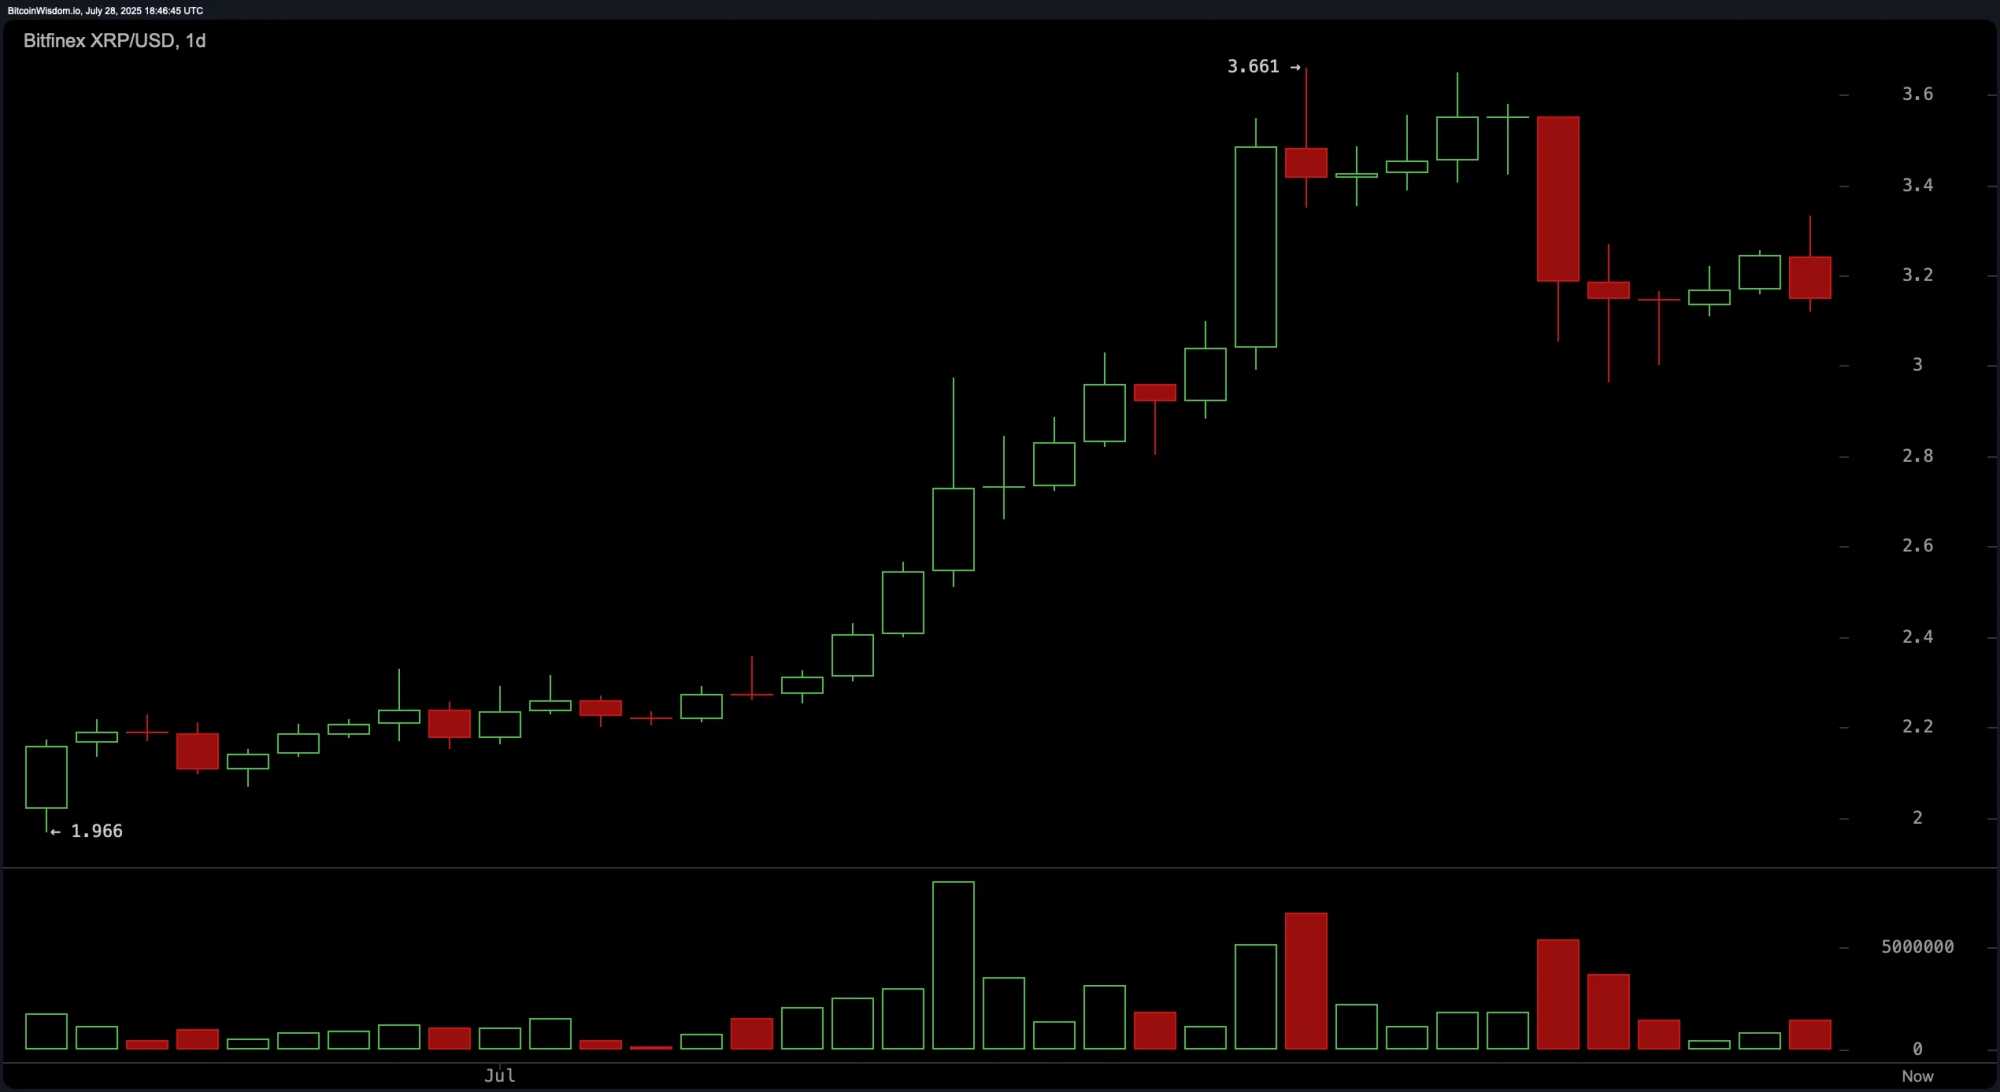 XRP/USD daily chart via Bitfinex on July 28, 2025.
Oscillators are largely neutral, offering no decisive momentum cues. The relative strength index (RSI) at 58.88, Stochastic at 45.84, commodity channel index (CCI) at 25.31, average directional index (ADX) at 47.34, and the Awesome oscillator at 0.42656 all suggest a lack of clear directional bias. The momentum indicator, however, signals weakness with a value of 0.26665, aligning with a negative signal. The moving average convergence divergence (MACD) level stands at 0.20821 and also flashes a bearish signal, hinting at continued downward pressure unless a reversal pattern forms.
Moving averages (MAs) present a mixed but increasingly bullish outlook on longer timeframes. Short-term averages, including the Exponential Moving Average (EMA) (10) at $3.20141 and the Simple Moving Average (SMA) (10) at $3.30160, are indicating sell signals, consistent with the current price being below these levels. However, the medium- and long-term moving averages such as the EMA (20) at $3.06266, SMA (20) at $3.10491, EMA (30) at $2.92032, and SMA (30) at $2.81670 all signal a buy. The longer-term trend remains intact, supported by the EMA (50) at $2.73167, SMA (50) at $2.55909, EMA (100) at $2.52586, and SMA (100) at $2.41559. This suggests that while short-term weakness persists, structural strength is still present in the broader market context.
Bull Verdict:
XRPs broader trend remains structurally bullish, supported by strong buy signals from mid- to long-term moving averages and prior gains from the $2.00 level. If the asset can reclaim the $3.30$3.35 resistance with volume confirmation, it may resume its upward trajectory toward the $3.50 and $3.66 targets. Momentum indicators will need to shift positively for this scenario to materialize, but underlying strength remains intact.
Bear Verdict:
XRPs recent price action is tilted toward the bearish side, with consistent rejections at key resistance levels, declining short-term momentum, and sell signals from both the momentum and MACD indicators. A failure to hold support at $3.10 or $3.00 could open the door to further losses, possibly testing sub-$2.95 levels. Until bulls decisively reclaim control, the risk-reward favors short-side strategies.