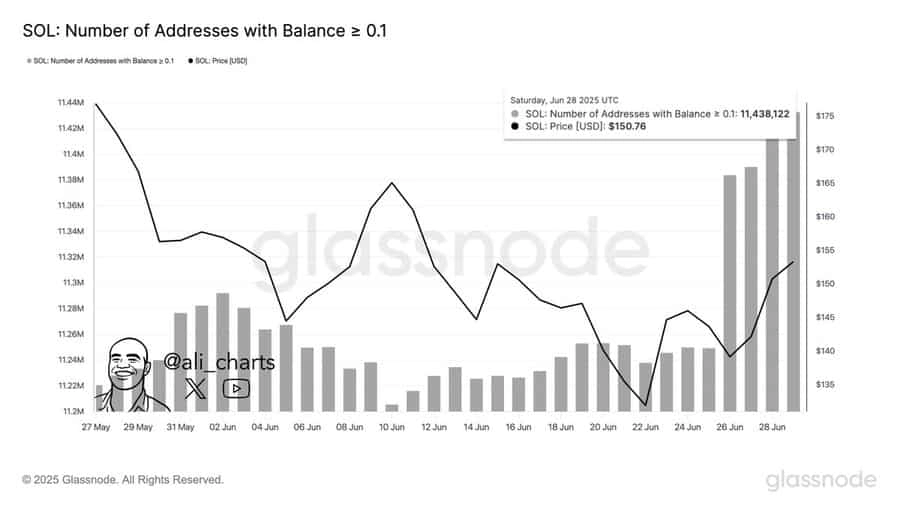
- Number of Addresses with Balance e 0.1 SOL hit a new all-time high.
- Both short- and medium-term chart structures suggest a potential rally remains in play if support levels hold.
Solana [SOL] dropped 2.61% on the 1st of July, trimming some of its weekly gains.
However, market insight suggested this dip may be temporary. Wallet balances significantly increased, accumulation remained strong, and price action showed bullish tendencies.
ATH in walletsWhats going on?
The Number of Addresses with Balance e 0.1 SOL surged to an all-time high of 11.44 million on the 28th of June, per Glassnode.
Source: CryptoQuant
That figure coincided with a jump in SOLs price to $150.76. Naturally, this uptick in small-holder activity hints at growing grassroots confidence.
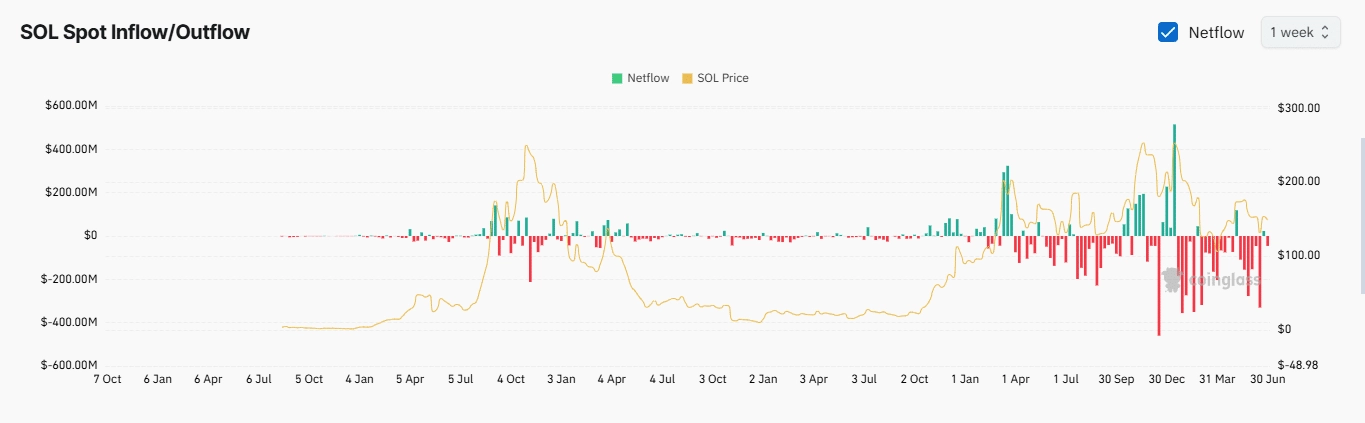
Moreover, Spot Netflow data from CoinGlass showed sustained outflows from centralized exchanges, totaling $525.32 million as of the 1st of July.
Source: CoinGlass
If these outflows continue to rise, they could contribute to a supply squeezean event where demand exceeds supply, potentially leading to a price surge.
The likelihood of a SOL rally remained strong, as Futures investors joined spot investors in signaling bullish sentiment.
Futures traders show their hand
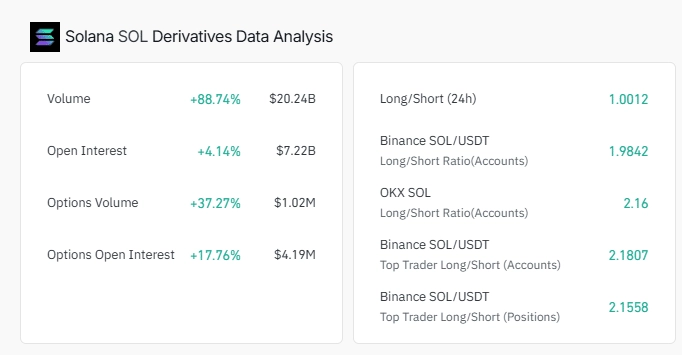
Theres been a notable surge in Open Interest across both options and Futures markets, according to CoinGlass.
SOL Futures Volume shot up 88.74% to $20.24 billion, while Futures Open Interest climbed 4.14% to $7.22 billion.
Options markets also saw bullish tractionOptions Volume rose 37.27%, and Options Open Interest jumped 17.76%.
Source: CoinGlass
Rising Open Interest across both derivative types points to a confident and expanding market posture. In fact, the Taker Buy/Sell Ratio confirmed it: buying activity was dominant, with the metric reading above 1.
The broader market showed a reading of 1.0012, while traders on Binance and OKX were even more bullish, with readings of 1.9842 and 2.16, respectively.
If this trend continues, it could further boost SOLs demand and push prices higher.
SOL attempts a price breakout, but faces hurdles
AMBCrypto analyzed the possible price outlook for SOL following the uptick in demand. Heres what the analysis revealed.
In the short term, SOL was trading within a bullish triangle pattern and has breached its immediate resistance, putting SOL a step away from a major breakout.
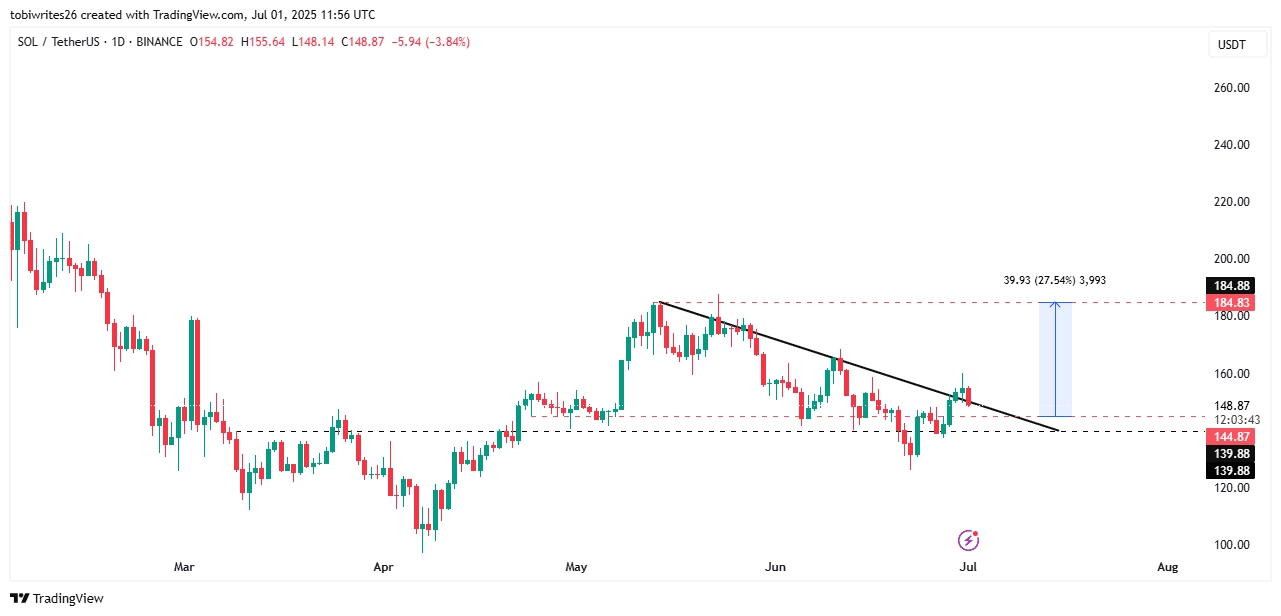
Source: TradingView
If the price bounces off key support levels at $144.87 or $139.88, it could retest the $184.88 marknearly 27% upside from the current level.
On the medium-term outlook, SOL traded within a similarly bullish structure, but with higher price targets.
In this scenario, SOL has yet to break the descending resistance line (black line), having faced rejection at that level.
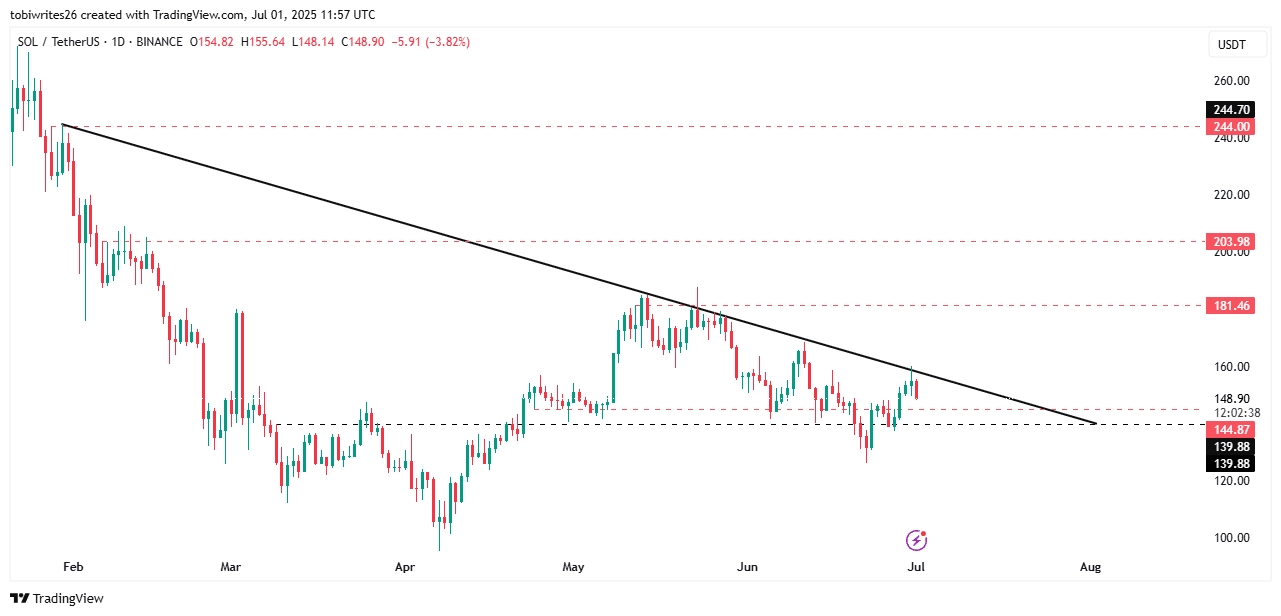
Source: TradingView
A successful breakout would likely send SOL to three key targets: $181.46, $203.98, and $244.00.
Given the price movement and slight decline, a move into the demand zone, followed by a breach of the resistance line, could spark a broader rally toward these targets.