Key Takeaways
ENS has a bullish outlook on the price charts for now, but the increased inflows to Binance and the reduced holder accumulation suggested selling pressure was winning the battle, which could see a price drop toward $25.
Ethereum Name Service [ENS] was trading at $28.63 on Thursday, the 31st of July. At press time, it has gained 1.3% for the day, taking the altcoins market capitalization to $1.04 billion.
Since the final week of June, when ENS dipped to $16.03, it has recovered to rally 71% in just over five weeks. This was an impressive performance.
Yet, the on-chain metrics showed that investors have reasons to be cautious.
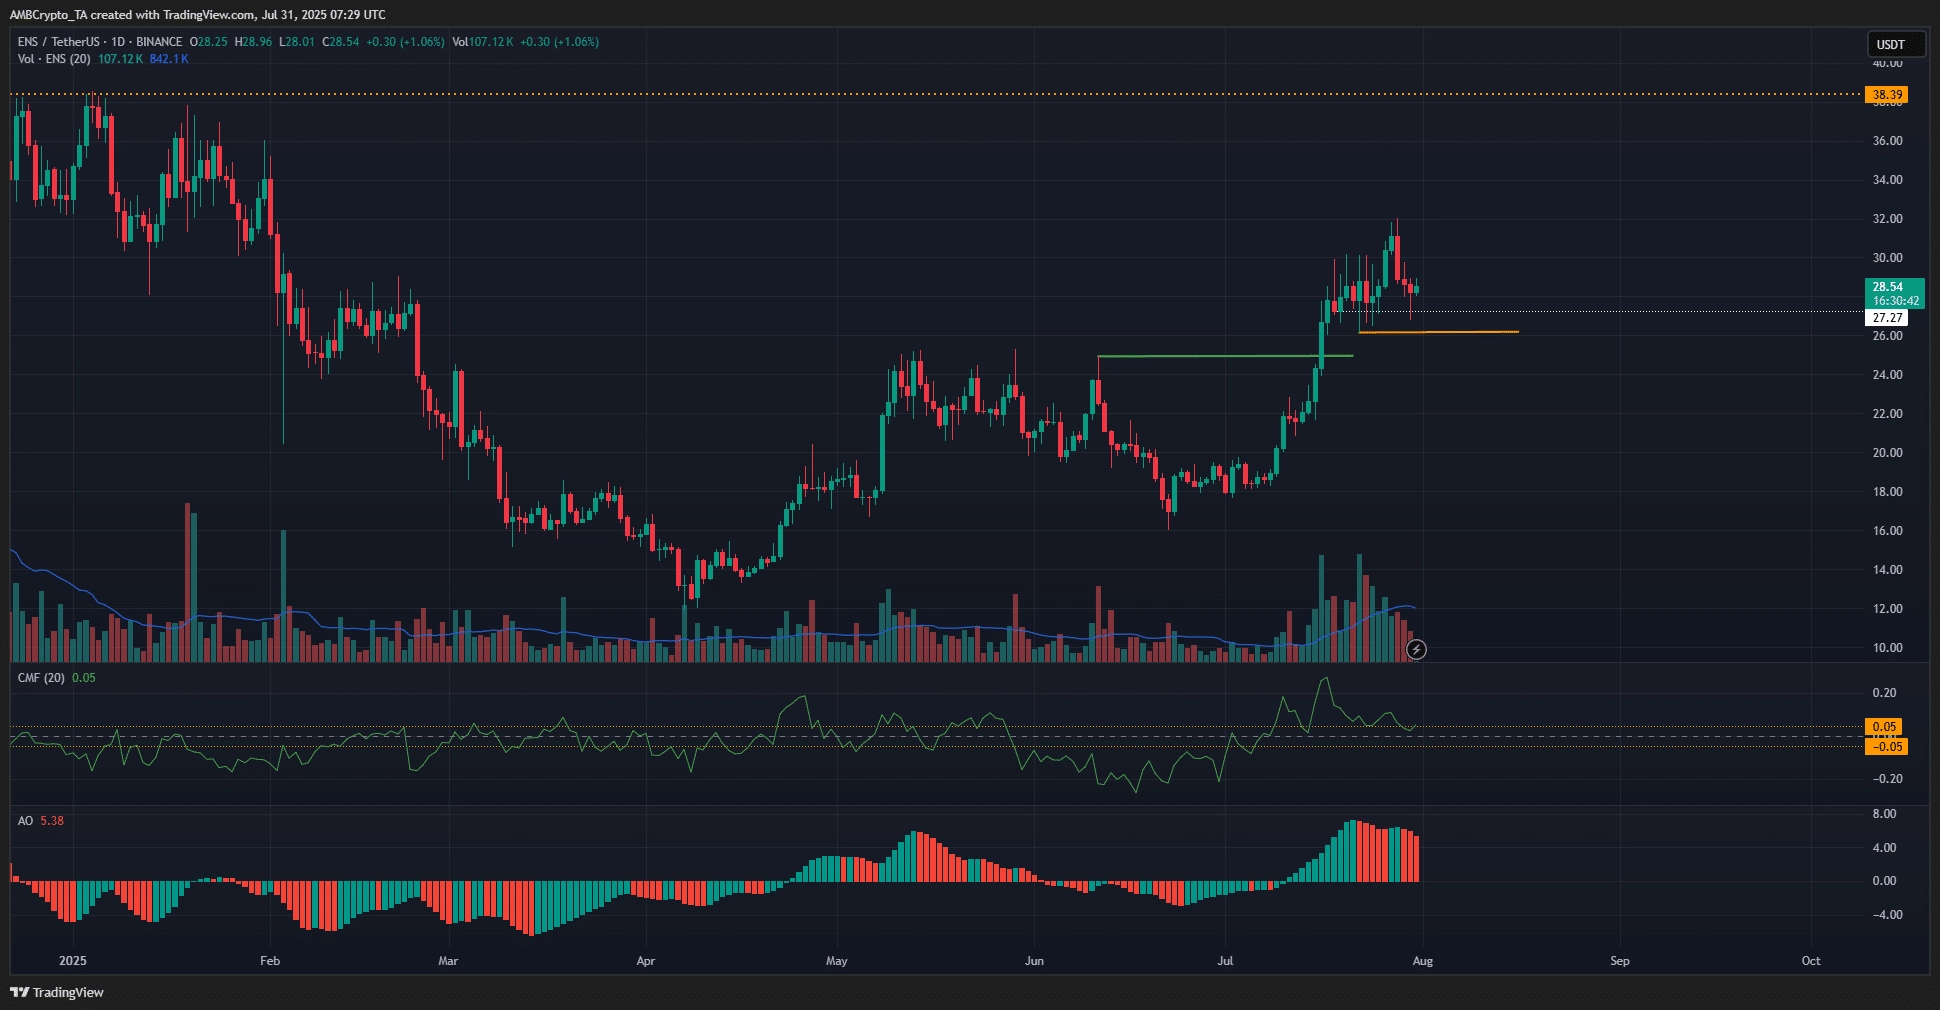
Source: ENS/USDT on TradingView
The price action was not too shabby from the bulls point of view. ENS was testing the $32 resistance level in recent days, but saw a rejection.
The $27 support zone is likely to offer a good buying opportunity, as the market structure on the 1-day chart remained bullish.
The Awesome Oscillator agreed, showing bullish momentum in progress. The CMF dipped from +0.27 on the 17th of July to +0.05 at press time. This reflected the reduced buying pressure over the past two weeks.
The higher low at $26.15 is key over the next few days. If the Ethereum Name Service token price dips below this level, traders can assume a bearish short-term outlook.
To the north, the $34 and $38 levels were the next price targets.
Signs that ENS holders might be lacking conviction
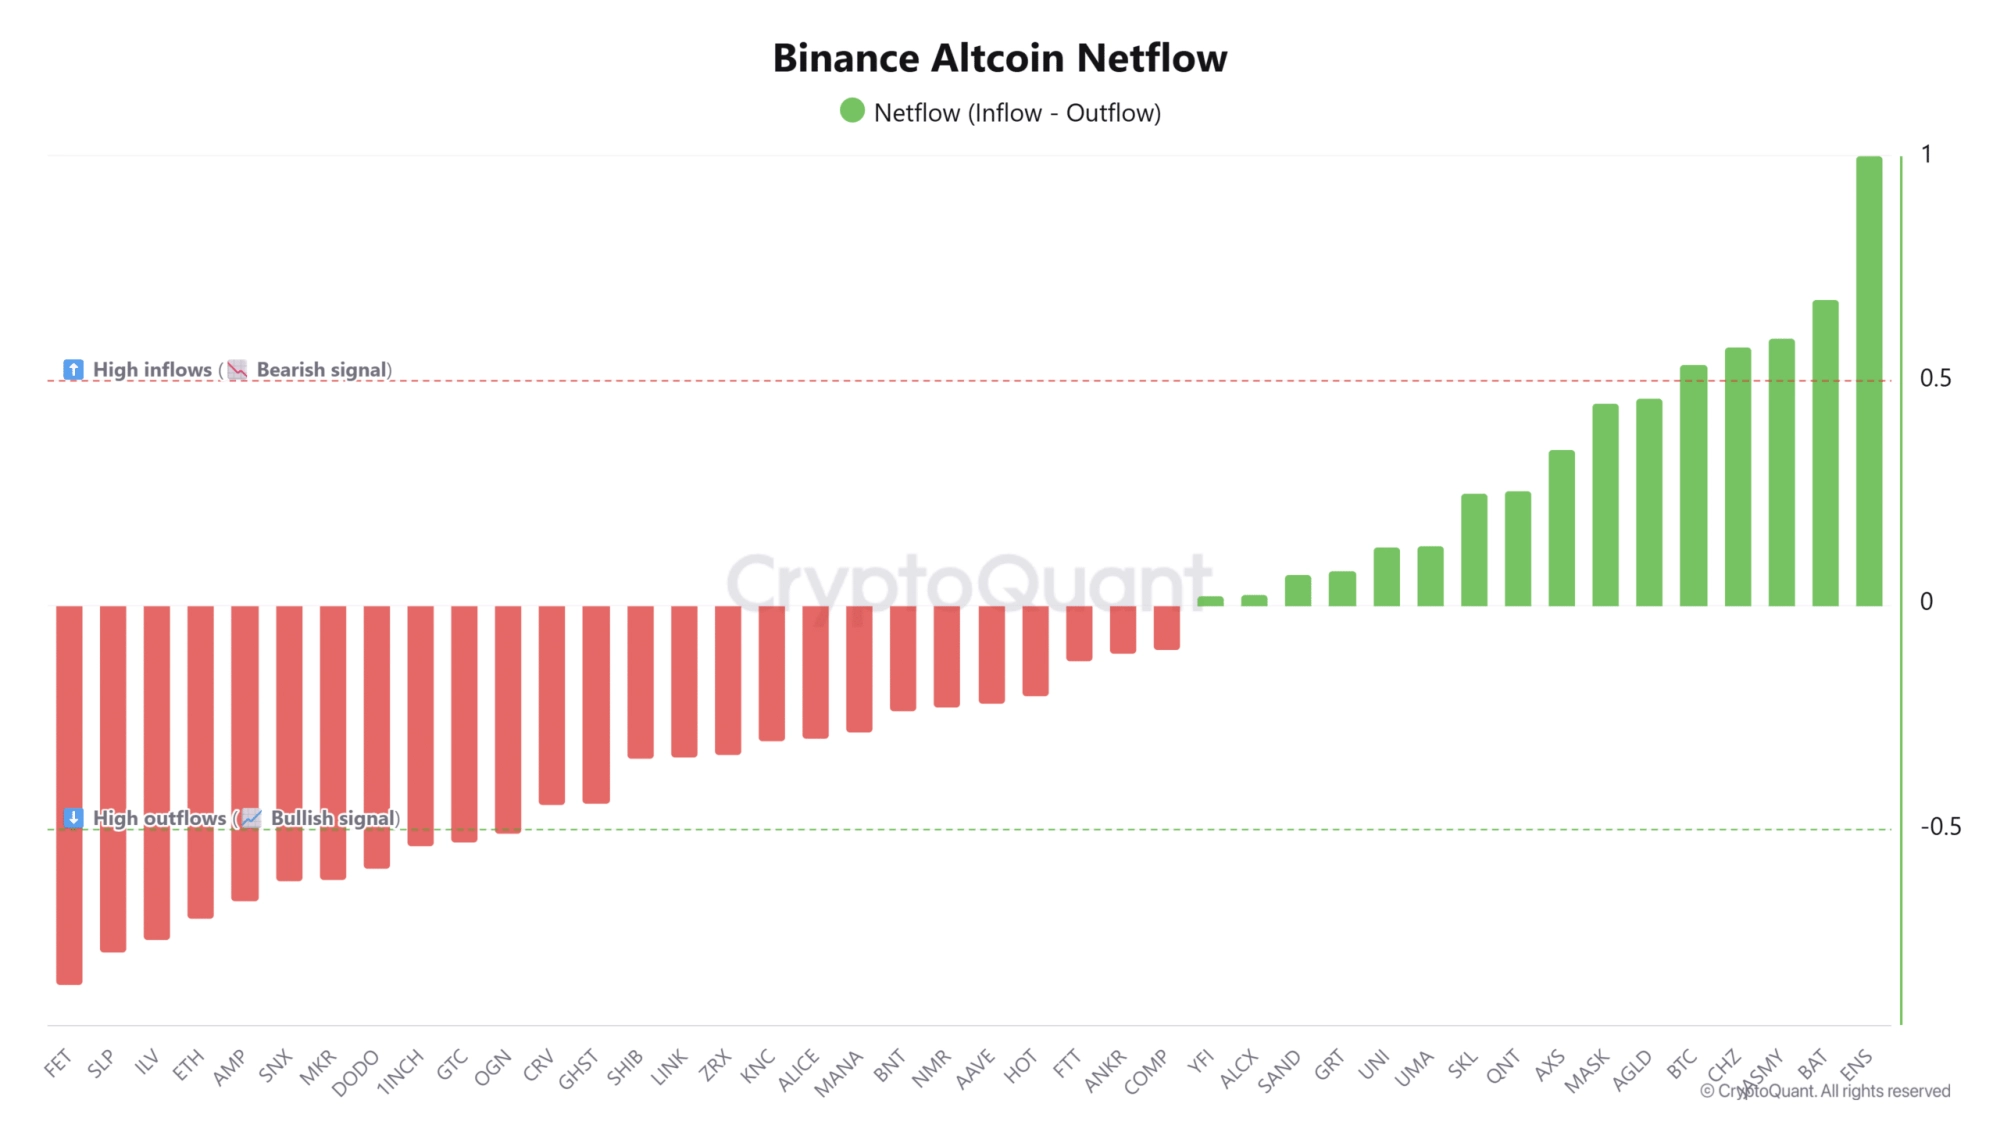
Source: CryptoQuant
The altcoin netflow to Binance chart showed that ENS saw the highest normalized 7-day average inflows to Binance.
Such high values indicated increased likelihood of selling pressure, and it was a strong bearish sign in the short to medium term.
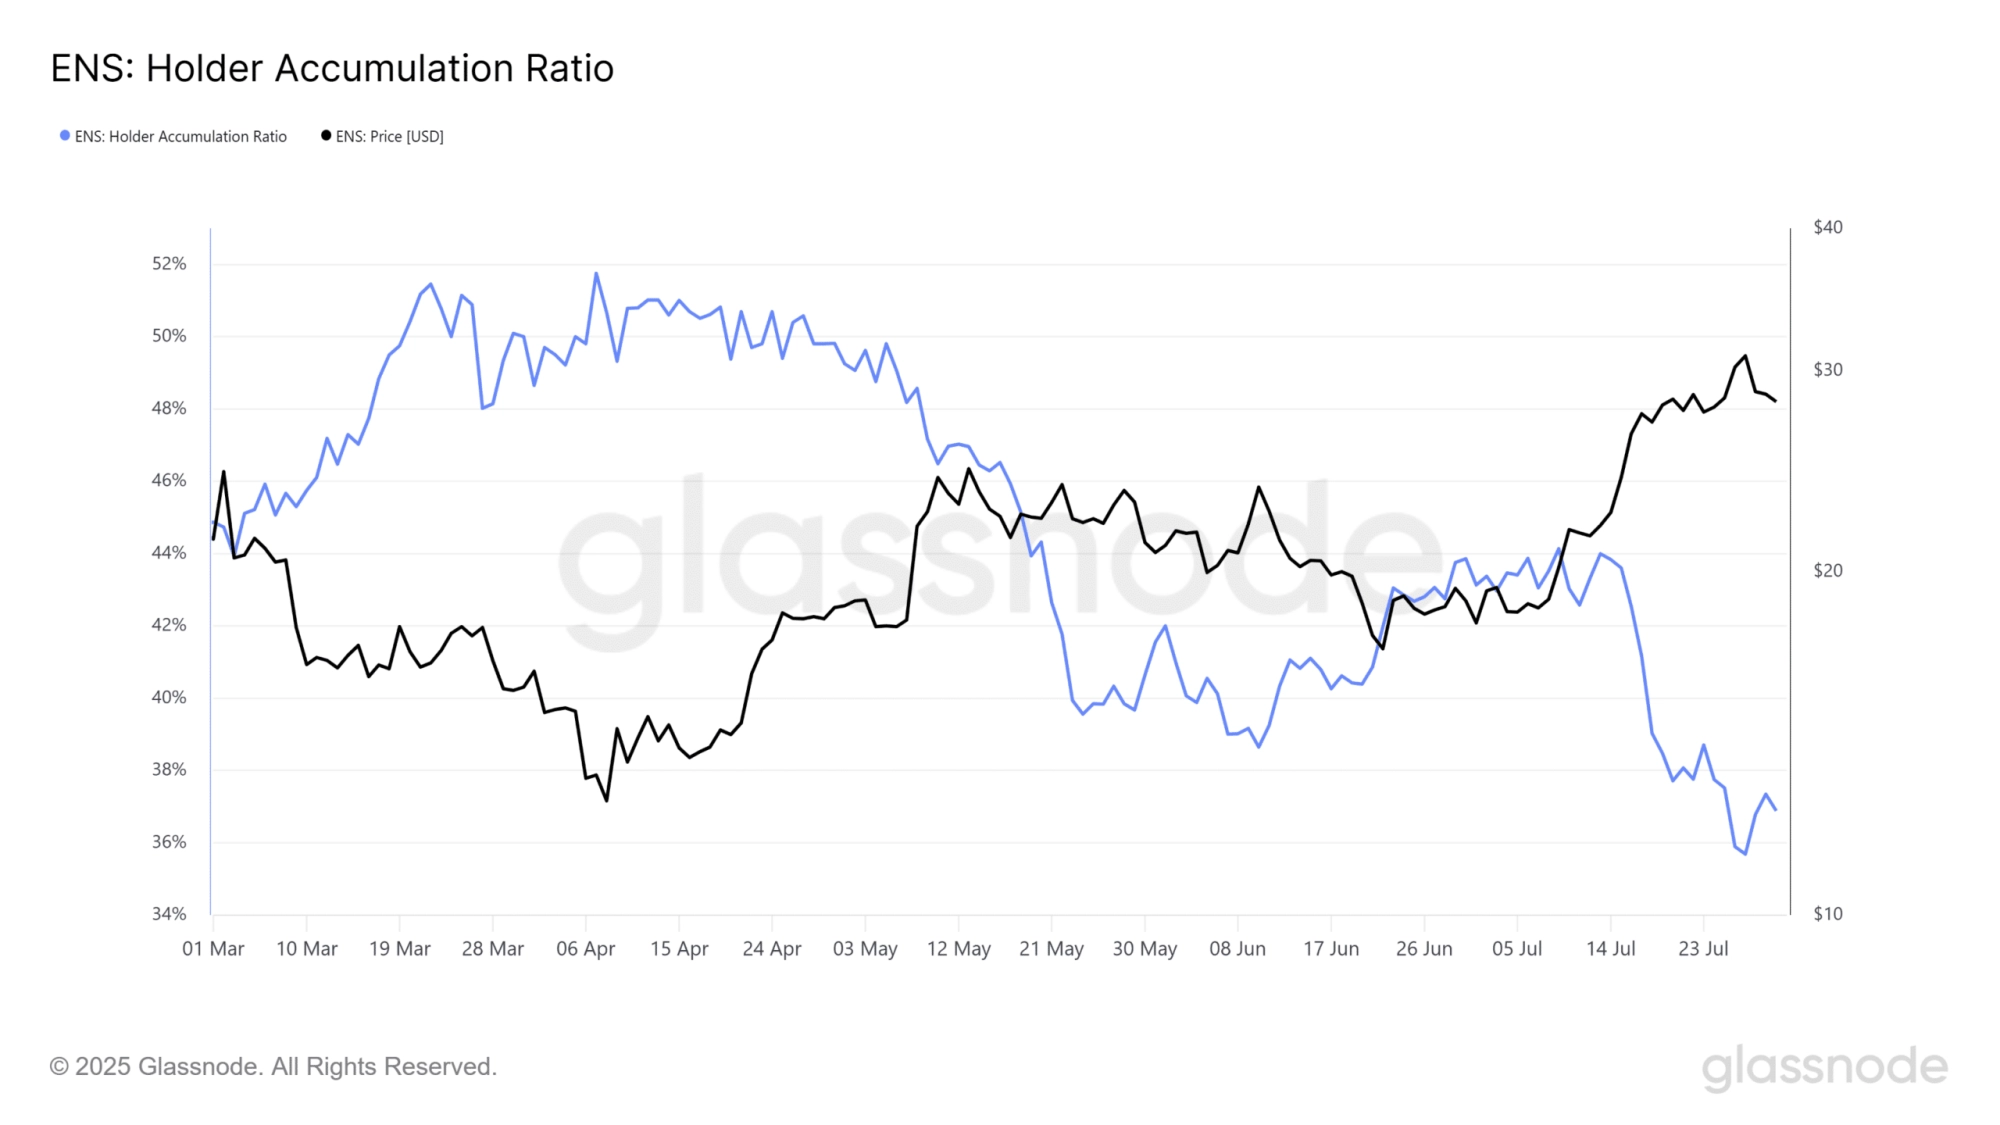
Source: Glassnode
Another concerning signal is the falling holder accumulation ratio, a metric that tracks whether active holders are growing or shrinking their positions.
While the ratio briefly crossed above 50% in April, it has been steadily declining ever sincedespite rising prices.
This trend suggests increased distribution and reveals a lack of conviction among investors, raising doubts about the rallys strength.
The 90-day spot taker CVD was neutral. It was encouraging that it wasnt showing seller dominance, but neither did it reflect buyer strength. The spot volume bubble map did not highlight euphoria either.
Overall, there was a good chance that sellers could regain control of the market. An early sign of this would be a price drop below $26.15. Buyers need to show conviction.
Without evidence of increased demand, a breakout past the $30-$32 resistance zone might not materialize.