
![]() Listen to Article Jun 21, 2025 Jamie Redman Crypto News
Listen to Article Jun 21, 2025 Jamie Redman Crypto News
13968 views
Based on historical data, the ten most heavily stocked bitcoin wallets collectively held over 1.12 million coins in 2023, accounting for approximately 5.66% of the current circulating supply. Jump ahead to the present, and these top ten addresses now control 5.55% of the supply, with a few notable shifts among the highest-ranking holders. What follows is an updated view of the leading BTC wallets as of June 20, 2025.
The Silent Giants of Crypto: Who Controls 5.55% of All Bitcoin?
At the time of publication, data reveals that the ten most heavily loaded bitcoin wallets contain a combined 1.10 million BTC, representing 5.55% of the current circulating supply, which stands at 19.88 million BTC. In 2023, the largest among them was Binances cold wallet, which held 248,598 BTCa figure that remains unchanged today.
Not a single satoshi has moved from this wallet since Jan. 7, 2023. Back then, Bitfinex claimed second place, but the standings have shiftedRobinhood now holds that position with 140,575 BTC. Robinhoods cold wallet rarely sees outbound activity; in fact, the last outgoing transaction occurred on Jan. 8, 2025.
The Bitfinex address now occupies third place with a holding of 130,010 BTC, though it has seen a reduction of 9,000 BTC over the past 30 days. Binances second cold wallet ranks fourth, currently containing 115,032 BTC, though it, too, has slimmed down by 19,249 BTC in the last month. Taking the fifth spot is the Bitfinex hack recovery wallet, with 94,643 BTC.
In sixth place is the well-known Mt Gox 1Feex hacker wallet, which holds 79,957 BTC. Tether, the issuer of a major stablecoin, is ranked seventh with 78,647 BTC. The eighth-largest wallet, holding 78,317 BTC, belongs to an unidentified entitythe only anonymous holder among the current top ten. In ninth place sits the U.S. Federal Bureau of Investigations wallet, containing 69,370 BTC seized from the Silk Road hacker.
Rounding out the list, the tenth-largest BTC wallet is managed by Binance and holds 68,200 BTC. This address serves as a BTCB reserve wallet for the firms wrapped bitcoin project. The current distribution of top bitcoin holdings reflects a dynamic but modest reshuffling among major custodians, blending institutional control with enigmatic ownership.
Static wallets, strategic withdrawals, and minimal outbound movements suggest calculated positioning rather than spontaneous activity. As the concentration subtly shifts, these addresses serve as silent indicators of custody practices and long-term intent within the broader architecture of bitcoins ongoing circulation.
Bitcoin (BTC) neutral WalletsImage Credits: Shutterstock, Pixabay, Wiki Commons

Enjoy a cleaner reading experience with reduced ads.
Read Comfortably in App
14588 views
Bitcoin traded at $108,220 today, with a market capitalization of $2.15 trillion and a 24-hour trading volume of $10.41 billion. Throughout the day, the cryptocurrency moved within an intraday price range of $107,138 to $108,320, indicating a narrow but significant consolidation zone in a broader bullish context.
Bitcoin
On the daily chart, bitcoins price action shows a strong V-reversal following a correction from a recent high of $110,789 to a low of $98,240. The rebound is marked by increasing volume and smaller-bodied green candlesticks, suggesting a slowing but still positive momentum. The price currently consolidates just below the $108,000 mark. A confirmed breakout above the $110,000 resistance with high volume could signal a continuation of the long-term uptrend. Key support zones remain at $103,000 and $98,000, where prior buying activity was concentrated.
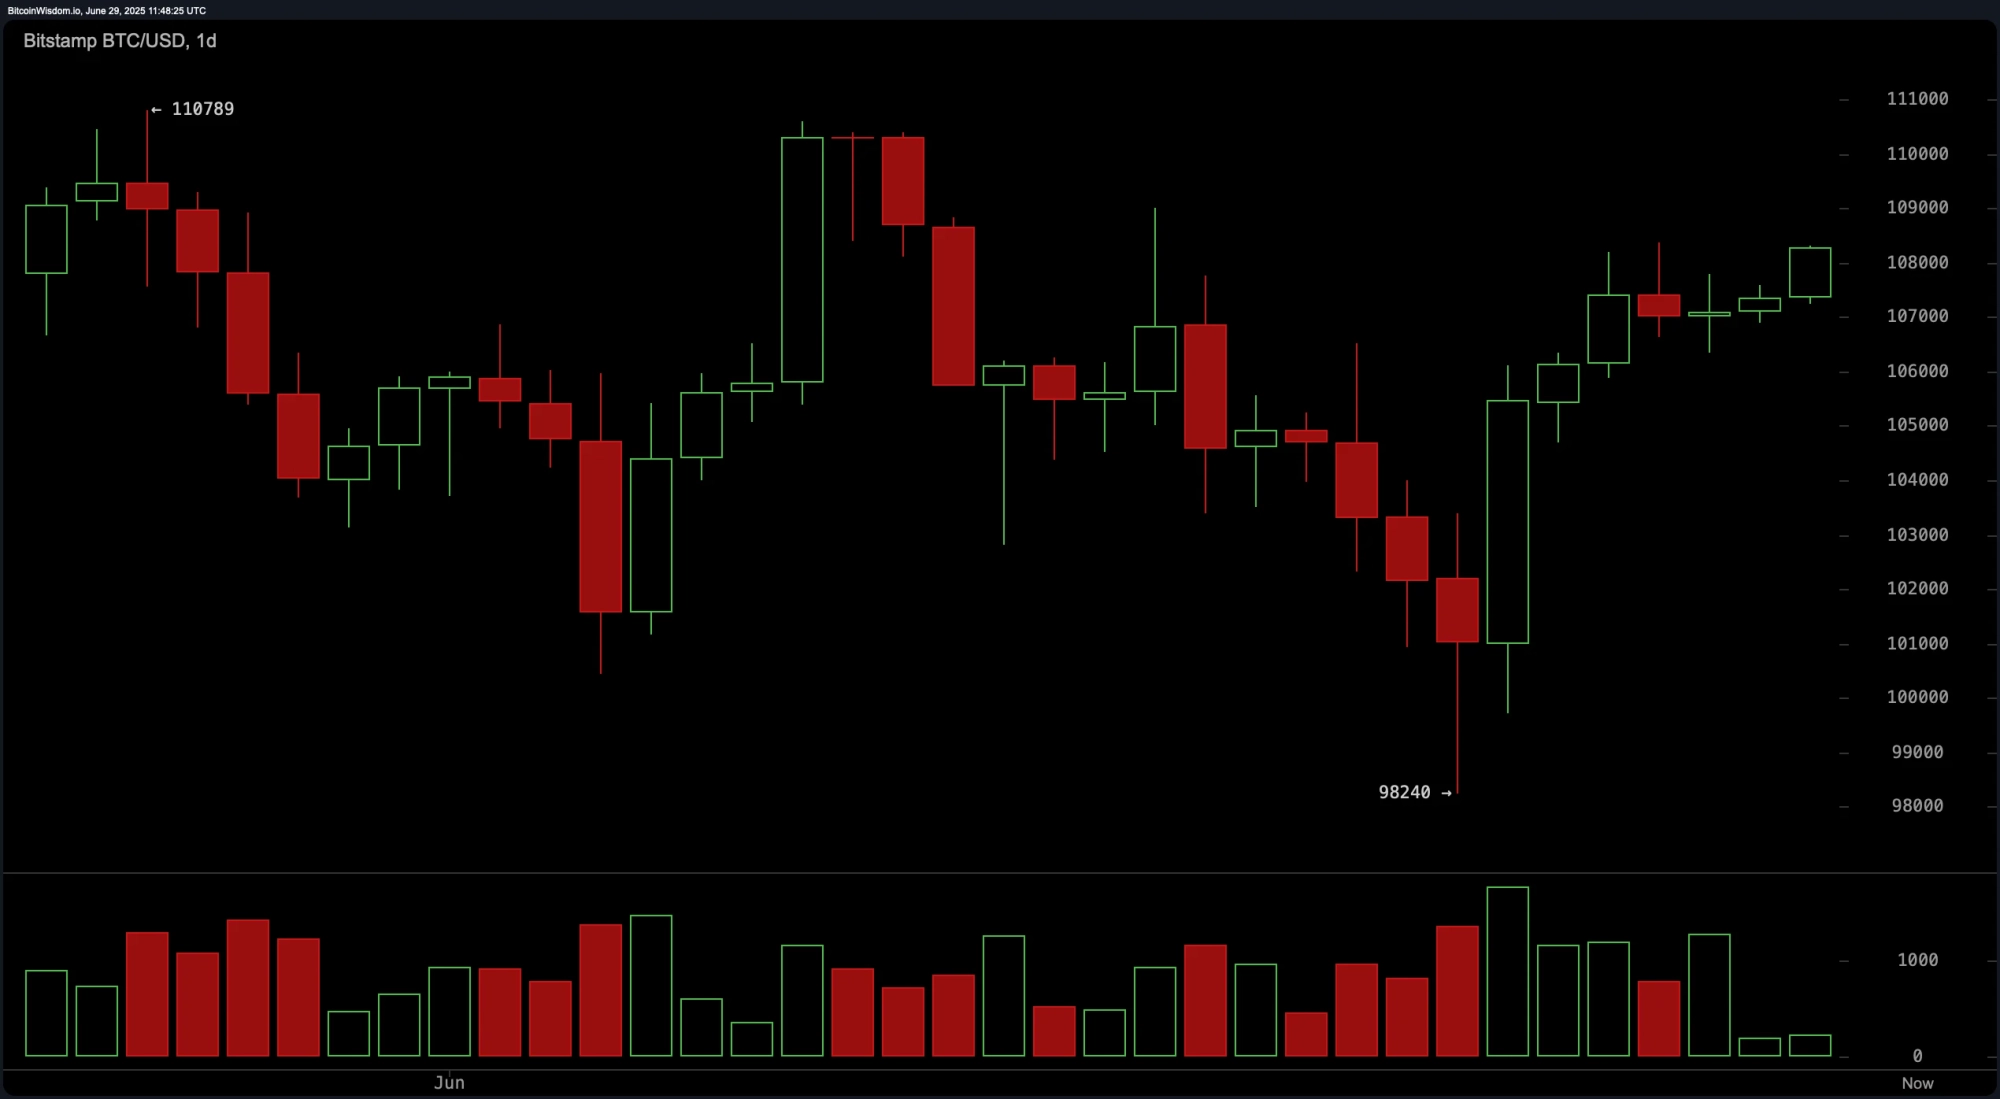 BTC/USD daily chart on June 29, 2025.
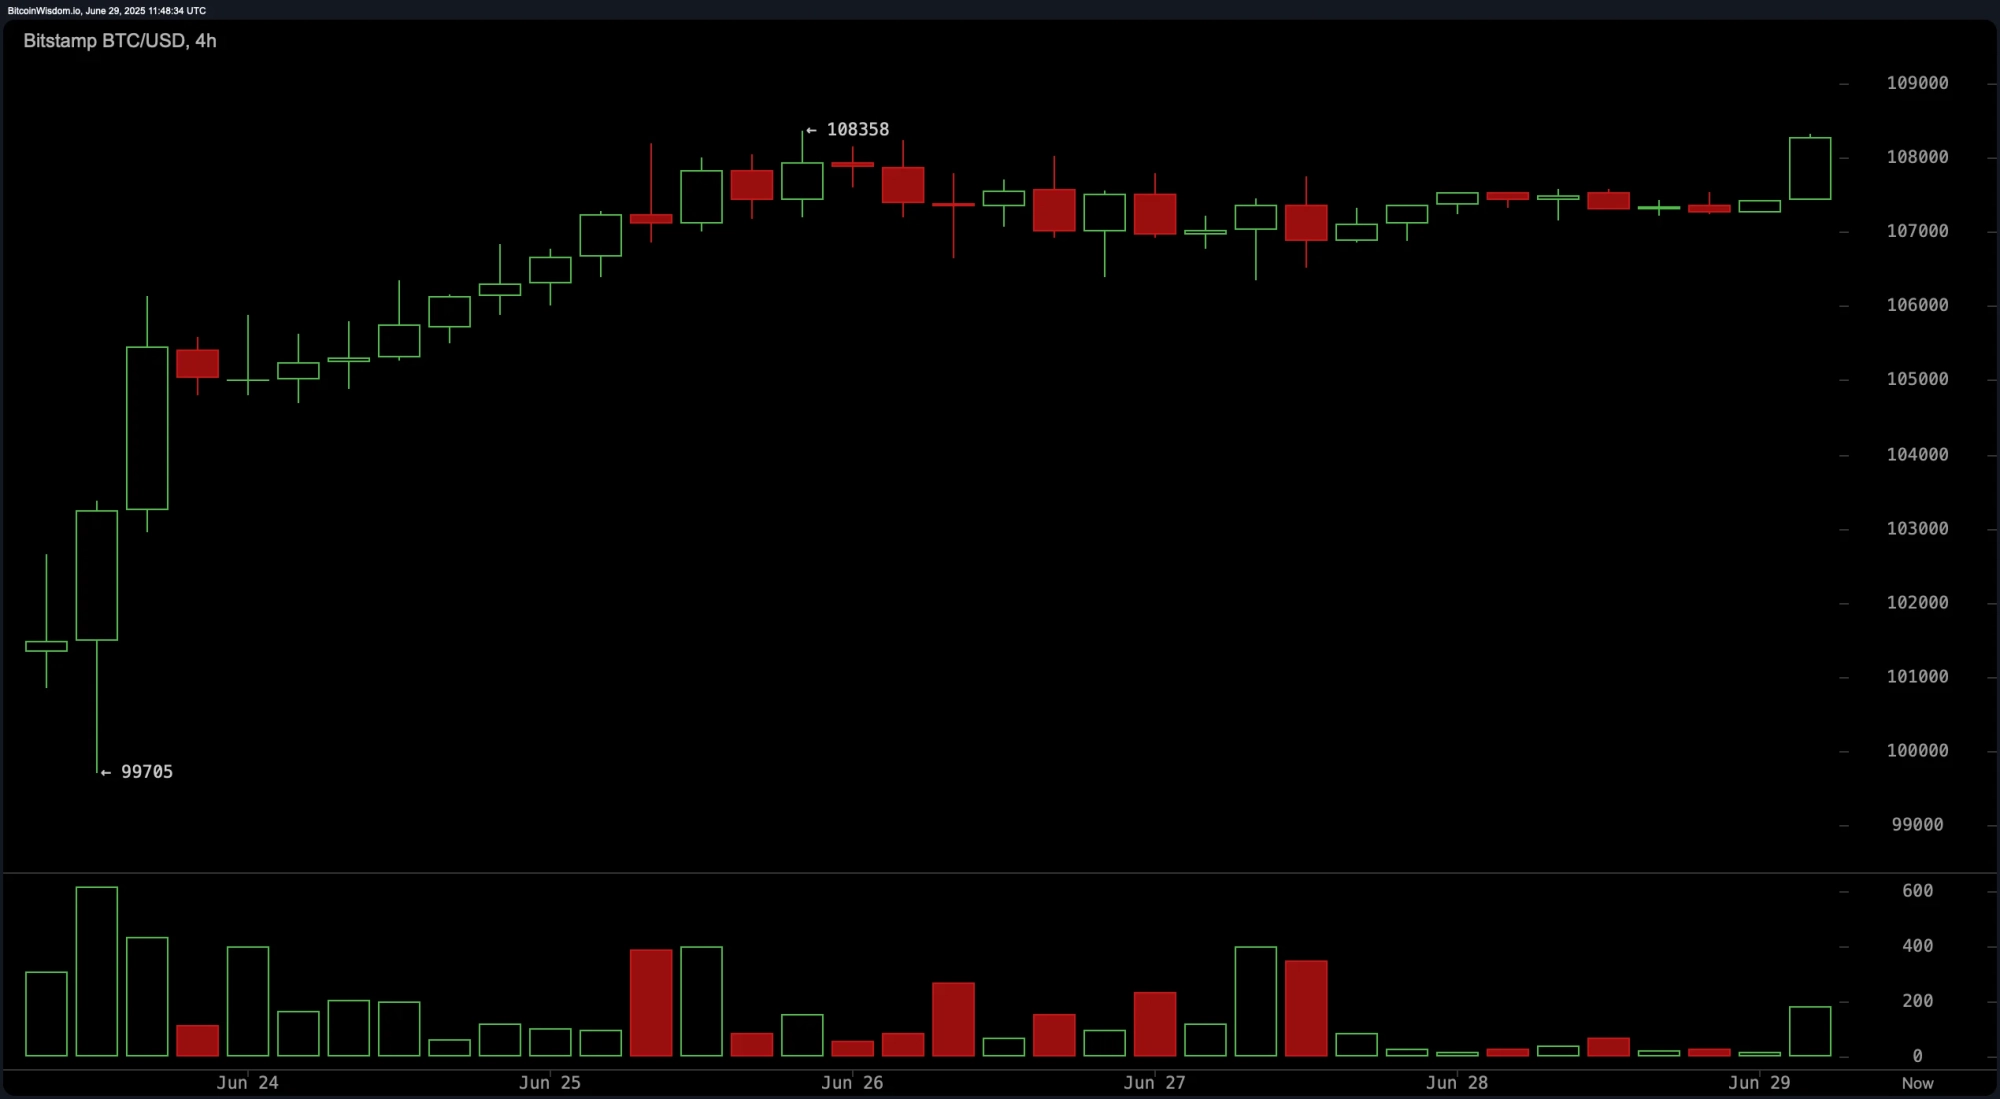
From a medium-term perspective, the 4-hour BTC/USD chart illustrates a bullish flag formation, underscored by a gradual upward grind. A breakout candle near the $108,358 level accompanied by a noticeable volume spike indicates buyers are gaining confidence. Should the price retest the $107,000 to $107,500 region successfully, it may present a lower-risk entry for bullish positions. Conversely, a sustained move below $106,800 would invalidate this short-term structure and necessitate a reassessment of directional bias.
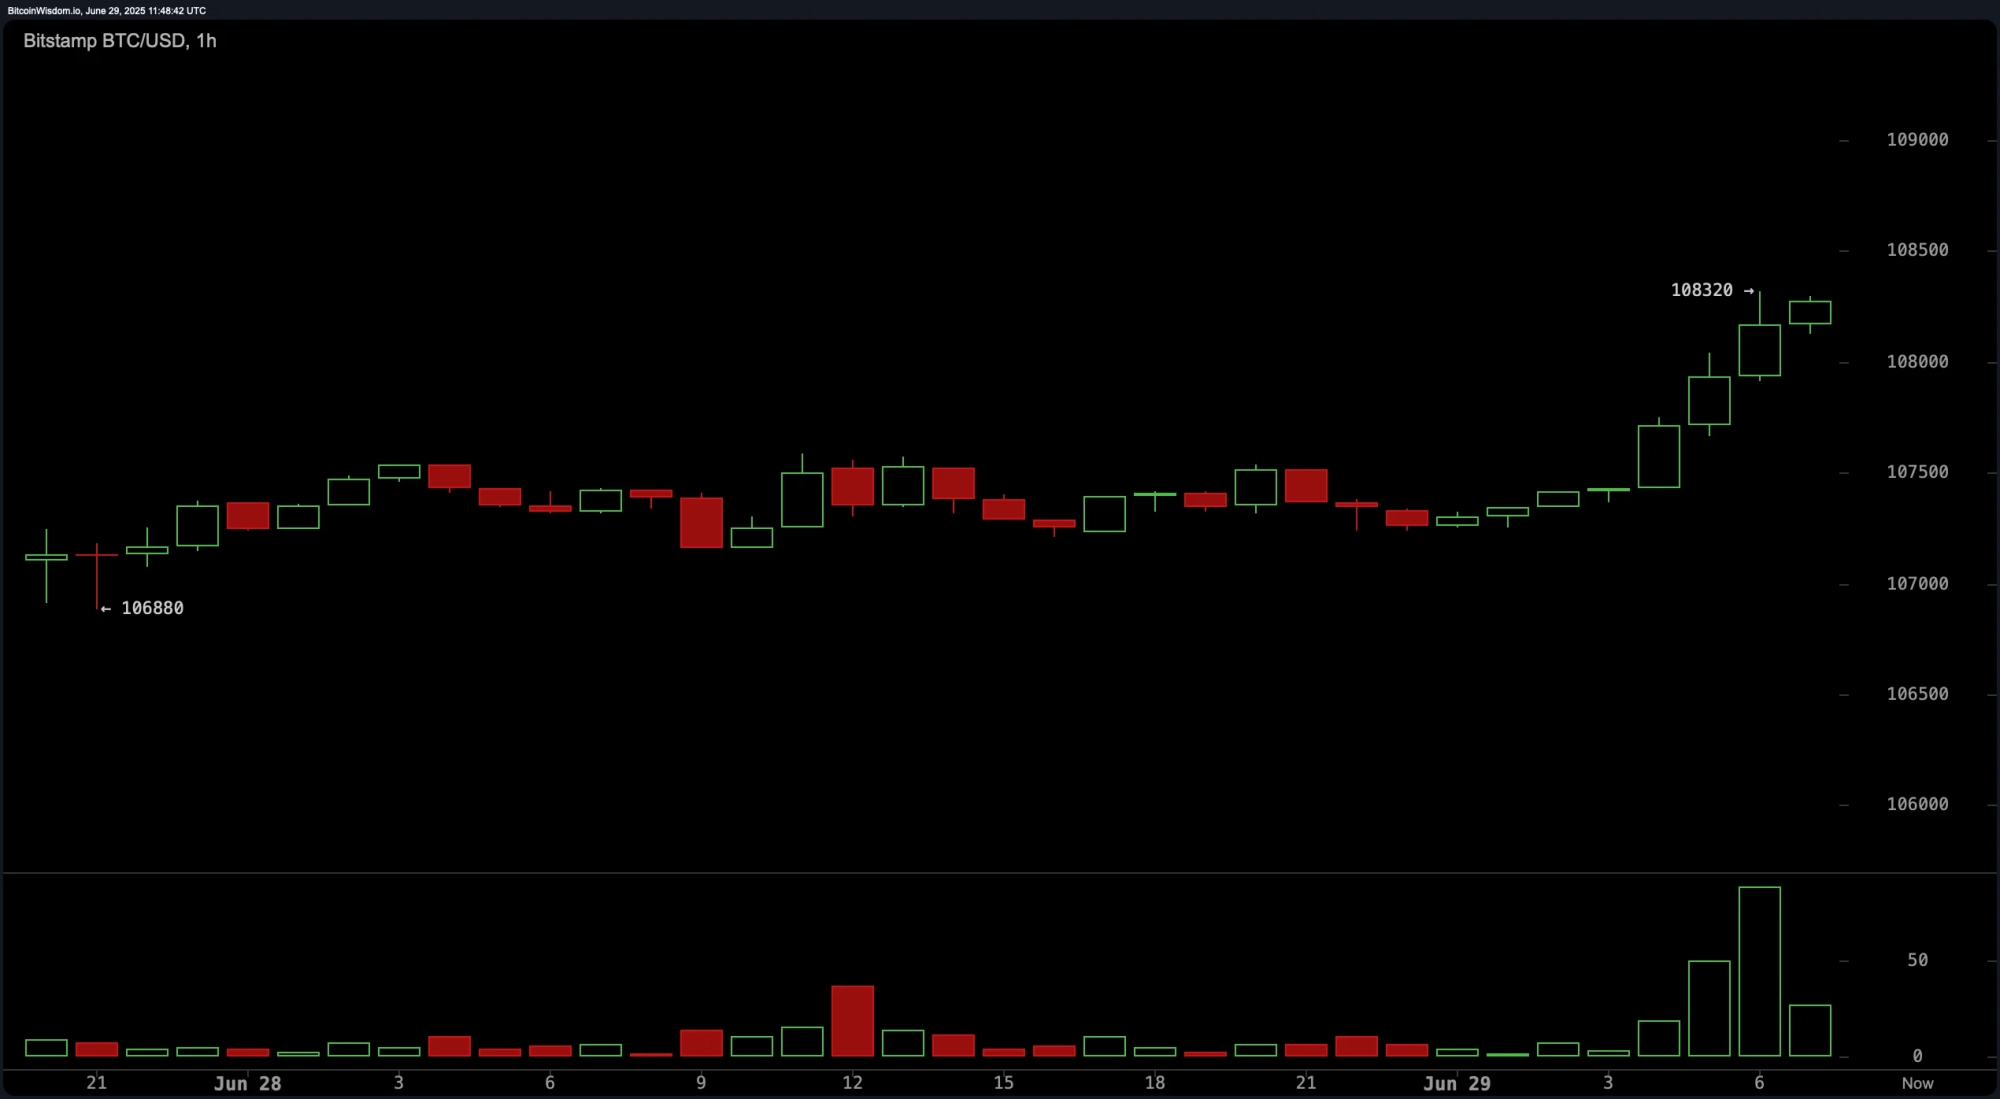
 BTC/USD 1-hour chart on June 29, 2025.
On the 1-hour chart, bitcoin demonstrates short-term momentum through a narrow consolidation followed by sharp upward moves. Volume confirmation during recent green candles validates a bullish breakout from what appears to be an accumulation zone. Traders looking to capitalize on this setup may consider entries on pullbacks toward the $107,700 to $108,000 range. Protective stops below $107,200 are prudent, particularly if accompanied by an uptick in sell-side volume.
 BTC/USD 4-hour chart on June 29, 2025.
Oscillator readings offer a largely neutral bias with nuanced bullish leanings. The relative strength index (RSI) sits at 59, indicating neither overbought nor oversold conditions. The Stochastic and commodity channel index (CCI) are also neutral, while momentum (10) and the moving average convergence divergence (MACD) are in buy territorysuggesting an upward bias is emerging. The average directional index (ADX) at 14 reflects a weak trend strength but does not conflict with the bullish signals from other momentum indicators.
All major moving averages (MAs) indicate strong bullish alignment. The exponential moving averages (EMA) and simple moving averages (SMA) across all key periodsfrom 10-day to 200-dayare positioned below the current price, each issuing a buy signal. The 10-day EMA at $106,462 and 10-day SMA at $105,524 suggest immediate short-term support, while longer averages such as the 200-day EMA at $94,475 and SMA at $96,224 confirm the prevailing uptrend is well-supported. These technical layers establish a firm foundation for potential upward continuation, contingent on volume and breakout confirmation.
Bull Verdict:
Given the alignment of all key moving averages in buy territory, alongside bullish signals from the momentum (10) and moving average convergence divergence (MACD), the technical structure across the 1-hour, 4-hour, and daily charts supports a continued uptrend. A breakout above $110,000 on strong volume could confirm bullish dominance and open the path to new highs.
Bear Verdict:
Despite bullish signals, oscillators such as the relative strength index (RSI) and Stochastic remain neutral, while the average directional index (ADX) reflects weak trend strength. A breakdown below $106,800 on the 4-hour chart or $107,200 on the 1-hour chartespecially with increasing volumewould invalidate the current setup and may trigger a short-term bearish reversal.
Bitcoin (BTC) Bullish markets and pricesImage Credits: Shutterstock, Pixabay, Wiki Commons