BONK just rallied almost 60% in seven days, and the sentiment is doing all the heavy lifting. With ETF hype building and a potential Golden Crossover nearing (yes, charts are at work, too), this Solana-based meme coin is back on the radar.
But with speculative momentum driving the move, can the BONK price break above $0.00002840, a key resistance level?
Arkhams one-year BONK netflow chart shows sustained negative net flows, which means more BONK is leaving exchanges than entering; a classic accumulation pattern, not sell pressure.
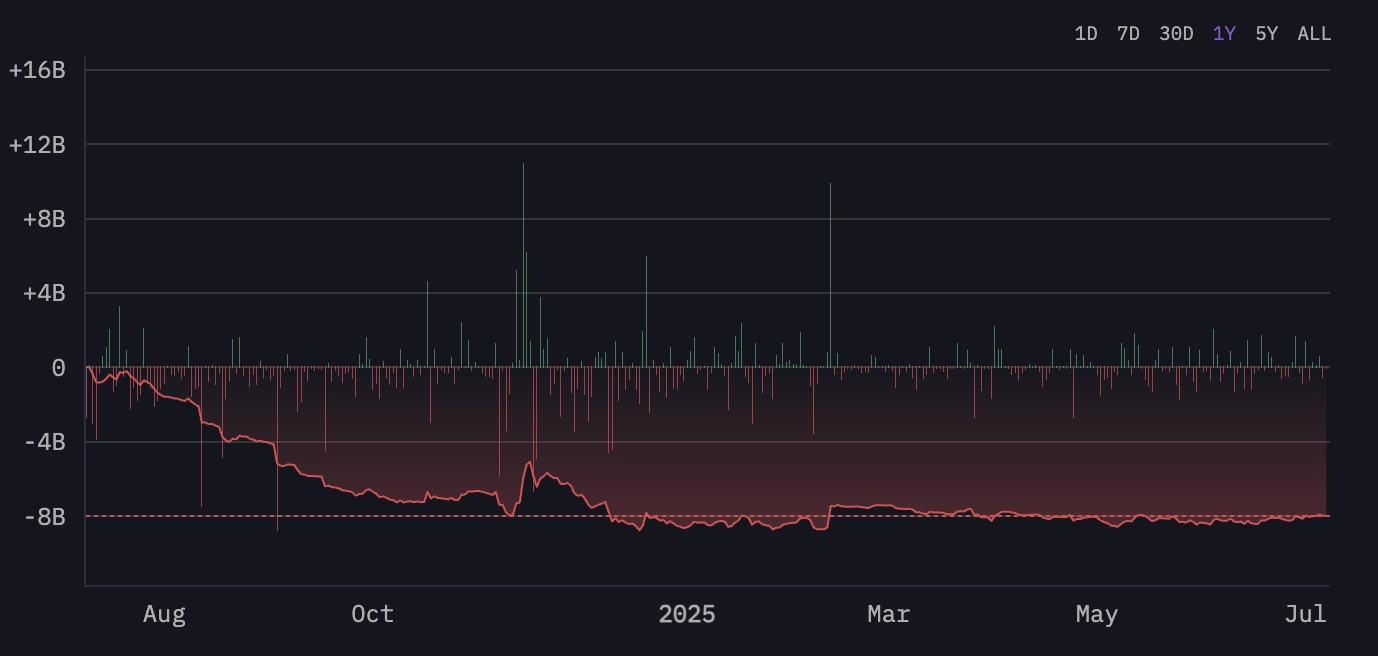 BONK netflow 1Y: Arkham
 However, zooming into the past 30 days, the trend is less aggressive. Netflows remain negative but have stabilized, indicating neutral-to-bullish positioning rather than panic-driven exits.
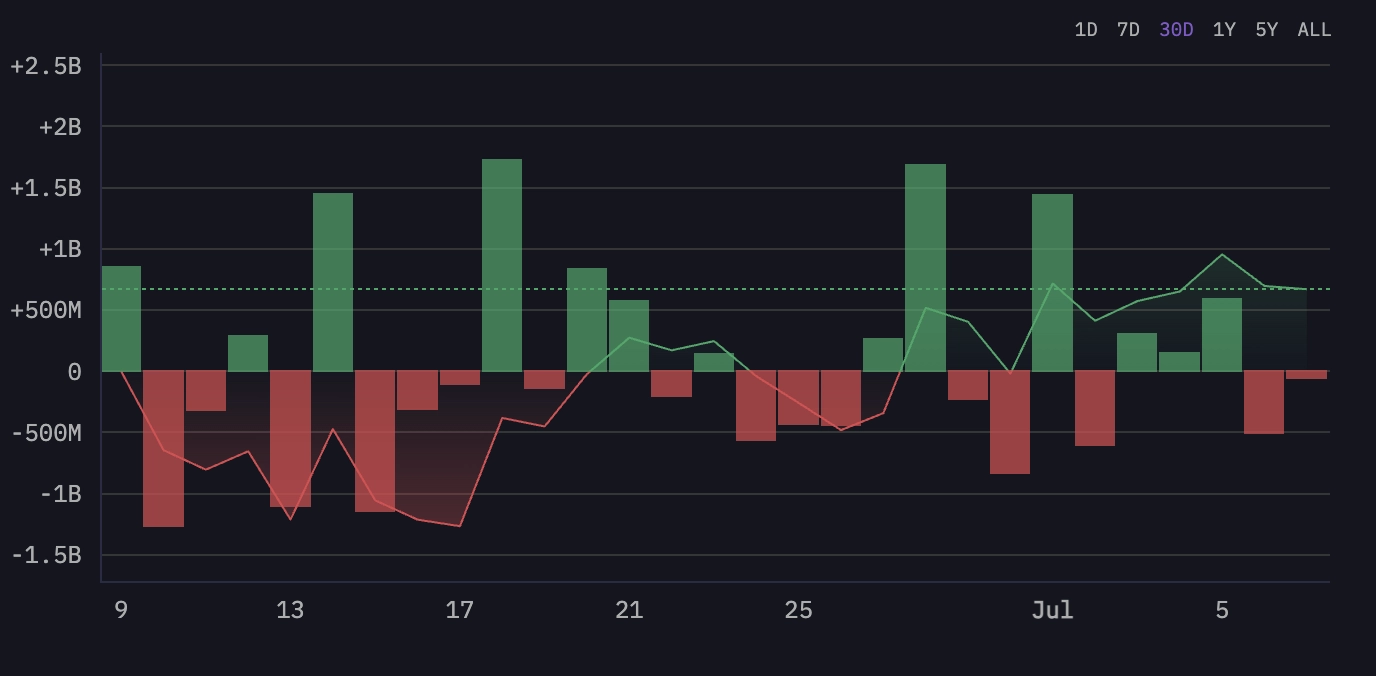 BONK netflow 30D: Arkham
 In short, the selling already happened months ago. What were seeing now is a supply crunch forming quietly, with recent sentiment pushing prices up faster than spot inflows can catch up.
BONKs Elder Ray Index just flipped into bullish territory, with bull power overtaking bear pressure; a sign that buyers are back in control.
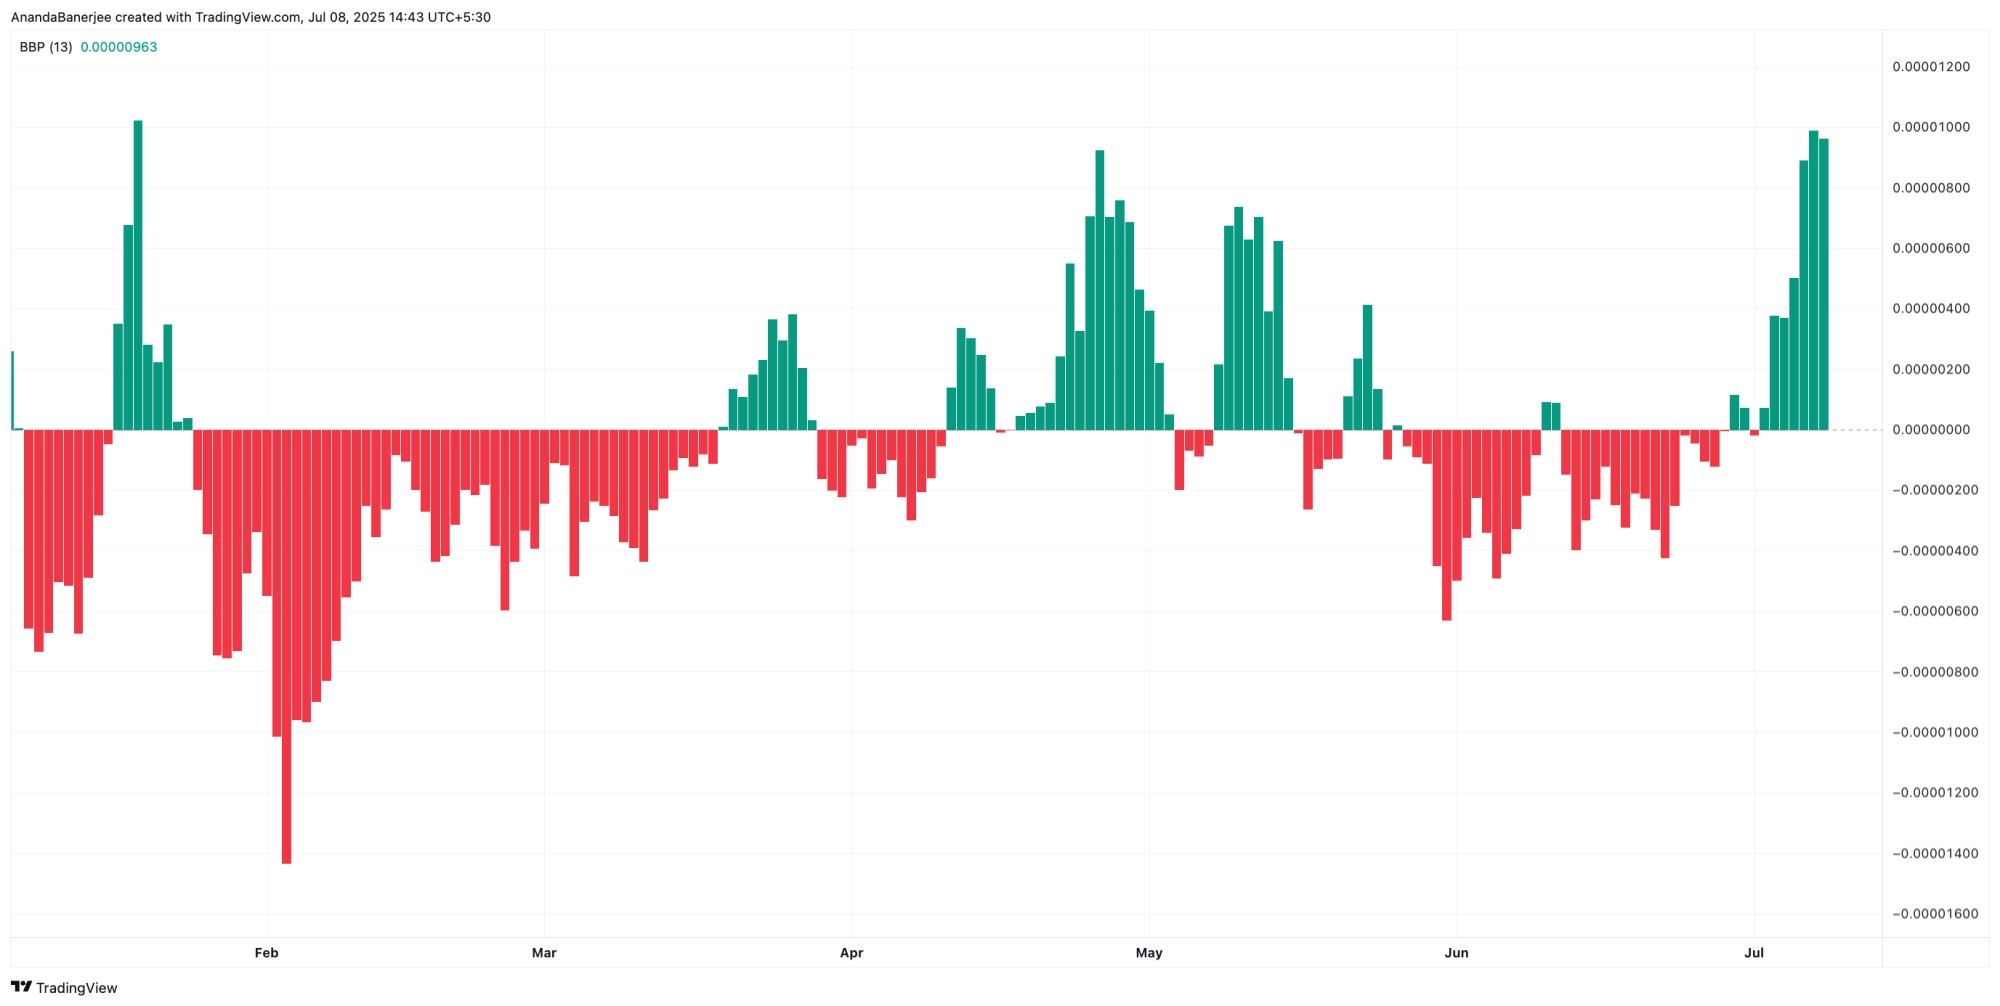 BONK bull bear power: TradingView
 The Elder Ray Index measures the strength of bulls and bears by comparing price action with a moving average; a positive reading means buyers are dominant.
One key indicator to watch is the looming Golden Crossover, where the 50-day EMA (the orange line) is about to cross above the 200-day EMA. EMAs, or Exponential Moving Averages, track price trends more sensitively than simple averages. When the shorter EMA crosses the longer one, its often seen as a bullish signal.
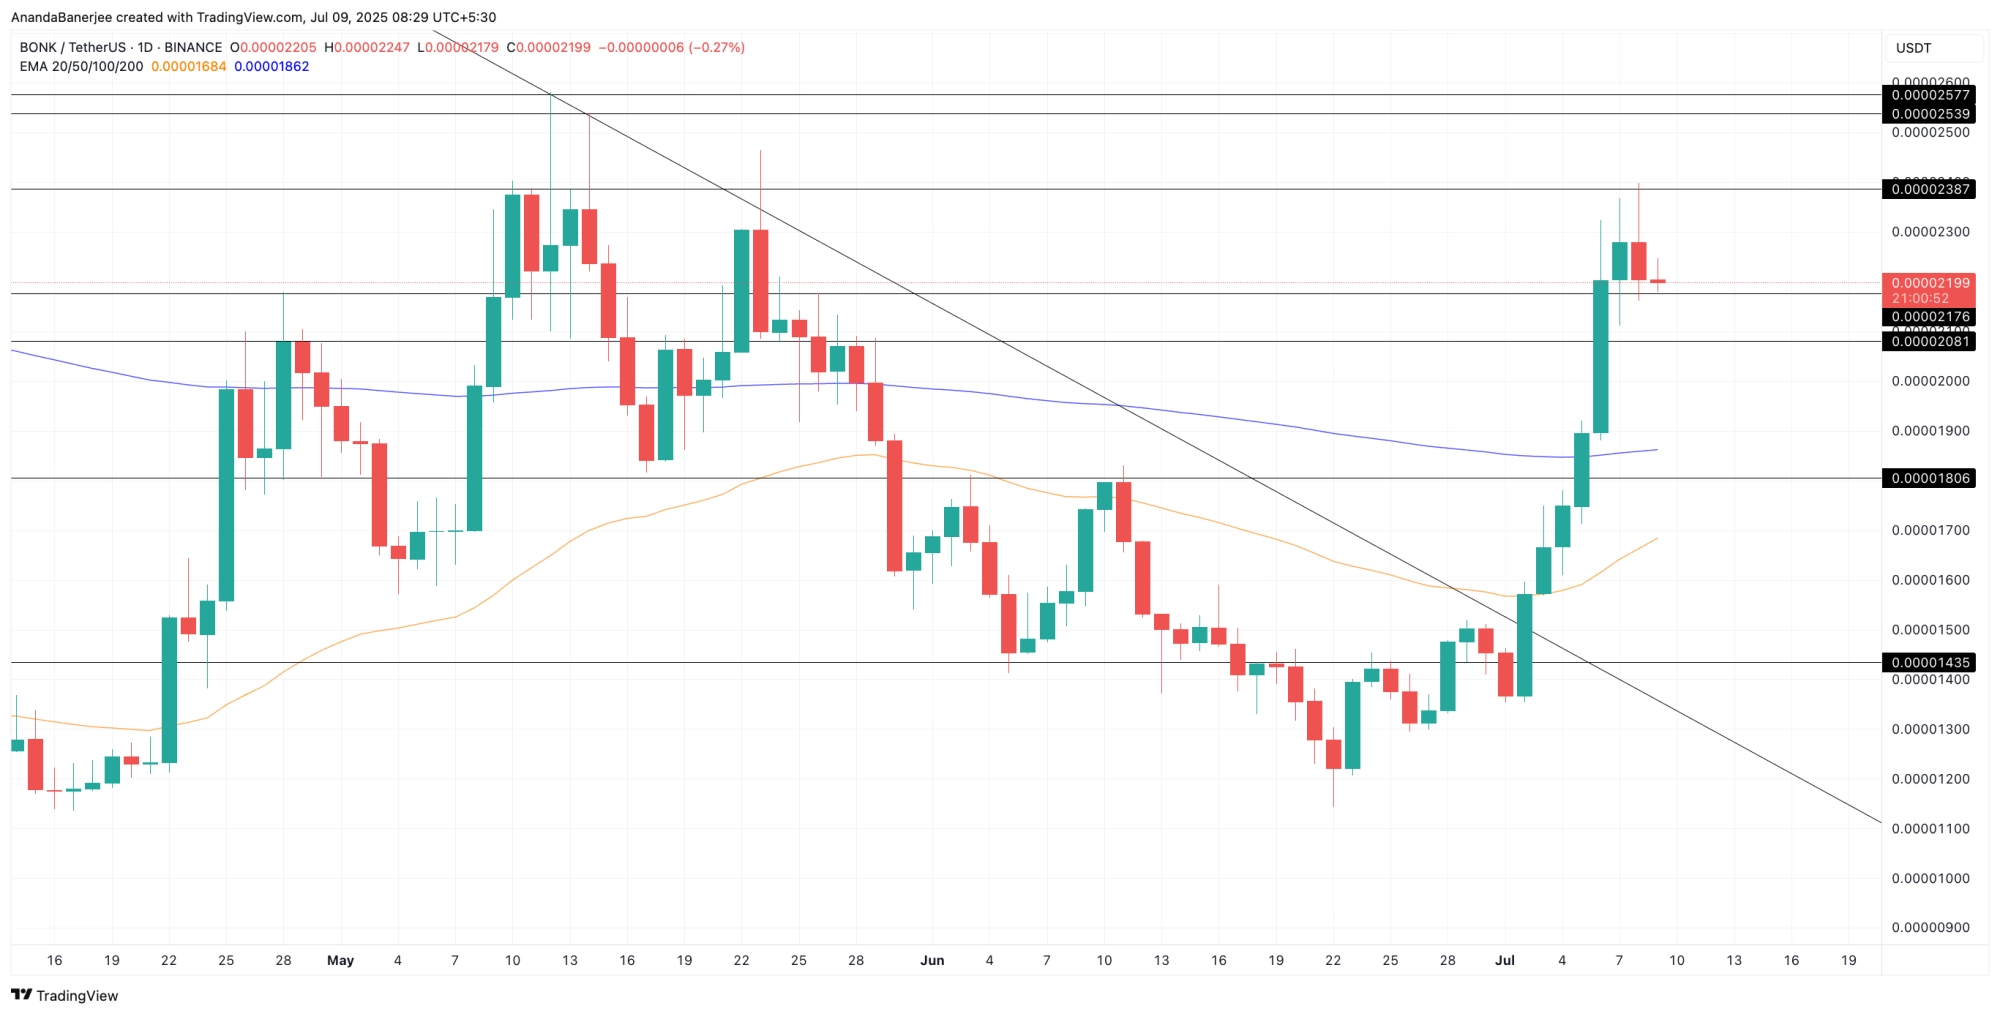 BONK price and the possible EMA crossover effect: TradingView
 If this crossover confirms in the coming days, BONK could push through resistance at $0.00002840 and attempt a run toward $0.00003600 or even higher.
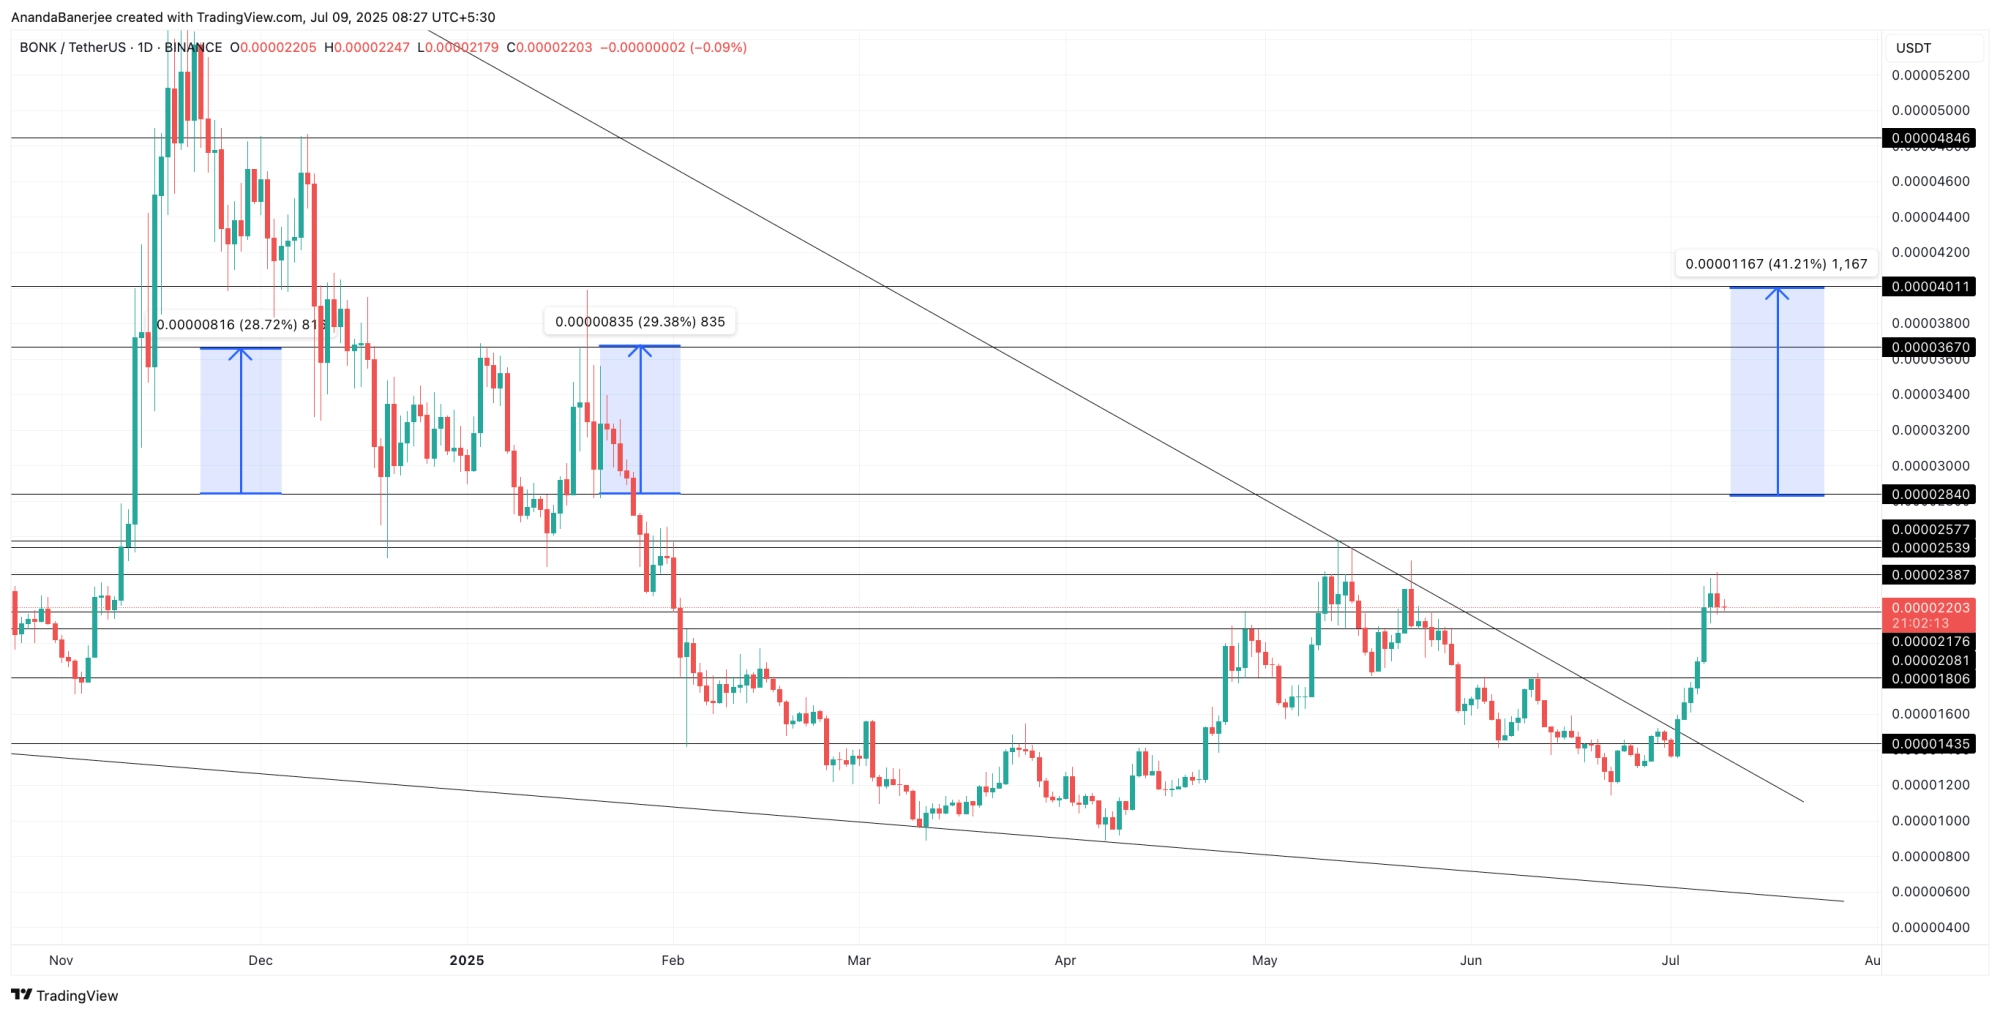
BONK price has officially broken out of a year-long falling wedge in the daily timeframe, a pattern thats typically seen as a bullish reversal setup. The breakout began when the price crossed above $0.00001550, confirming strength after months of compression between lower highs and stable support.
 BONK price analysis: TradingView
 As of now, BONK is consolidating around $0.00002203, just beneath a key resistance zone near $0.00002389. Another key resistance level in the short term is $0.00002577. If the price breaks above this band with volume, the next upside targets lie at $0.00002840, followed by $0.00003670.
Notably, the zone between $0.00002840 and $0.00003670 doesnt feature many strong resistance points.
For now, the structure favors continuation, but bulls will need a clean breakout above $0.00002577$0.00002840 to unlock higher targets.
If BONK slides below $0.00001806, the breakout loses momentum. A fallback under $0.00001435 would confirm a failed reversal, putting the wedge pattern in doubt.
Disclaimer
In line with the Trust Project guidelines, this price analysis article is for informational purposes only and should not be considered financial or investment advice. BeInCrypto is committed to accurate, unbiased reporting, but market conditions are subject to change without notice. Always conduct your own research and consult with a professional before making any financial decisions. Please note that our Terms and Conditions, Privacy Policy, and Disclaimers have been updated.