Bitcoins price stands at $115,497 as of Aug. 19, 2025, positioning the asset within a $2.3 trillion market capitalization and a 24-hour trading volume of $37.47 billion. Over the past 24 hours, bitcoin traded within a narrow intraday range of $114,733 to $116,996, pointing to a consolidative phase after recent volatility.
 Jamie Redman
Bitcoin
The daily chart reveals that bitcoin recently faced a sharp rejection at $124,517, forming a bearish engulfing pattern that initiated a sustained downward channel. This downturn culminated in a low at $111,919, which held as support but only yielded a weak bounce. Trading volume spiked at the top, indicating profit-taking and the onset of distribution. The overall market structure on the daily timeframe remains bearish, and the absence of a meaningful bullish reversal leaves the risk of a breakdown below $111,919 viable, with the next key support anticipated between $108,000 and $110,000.
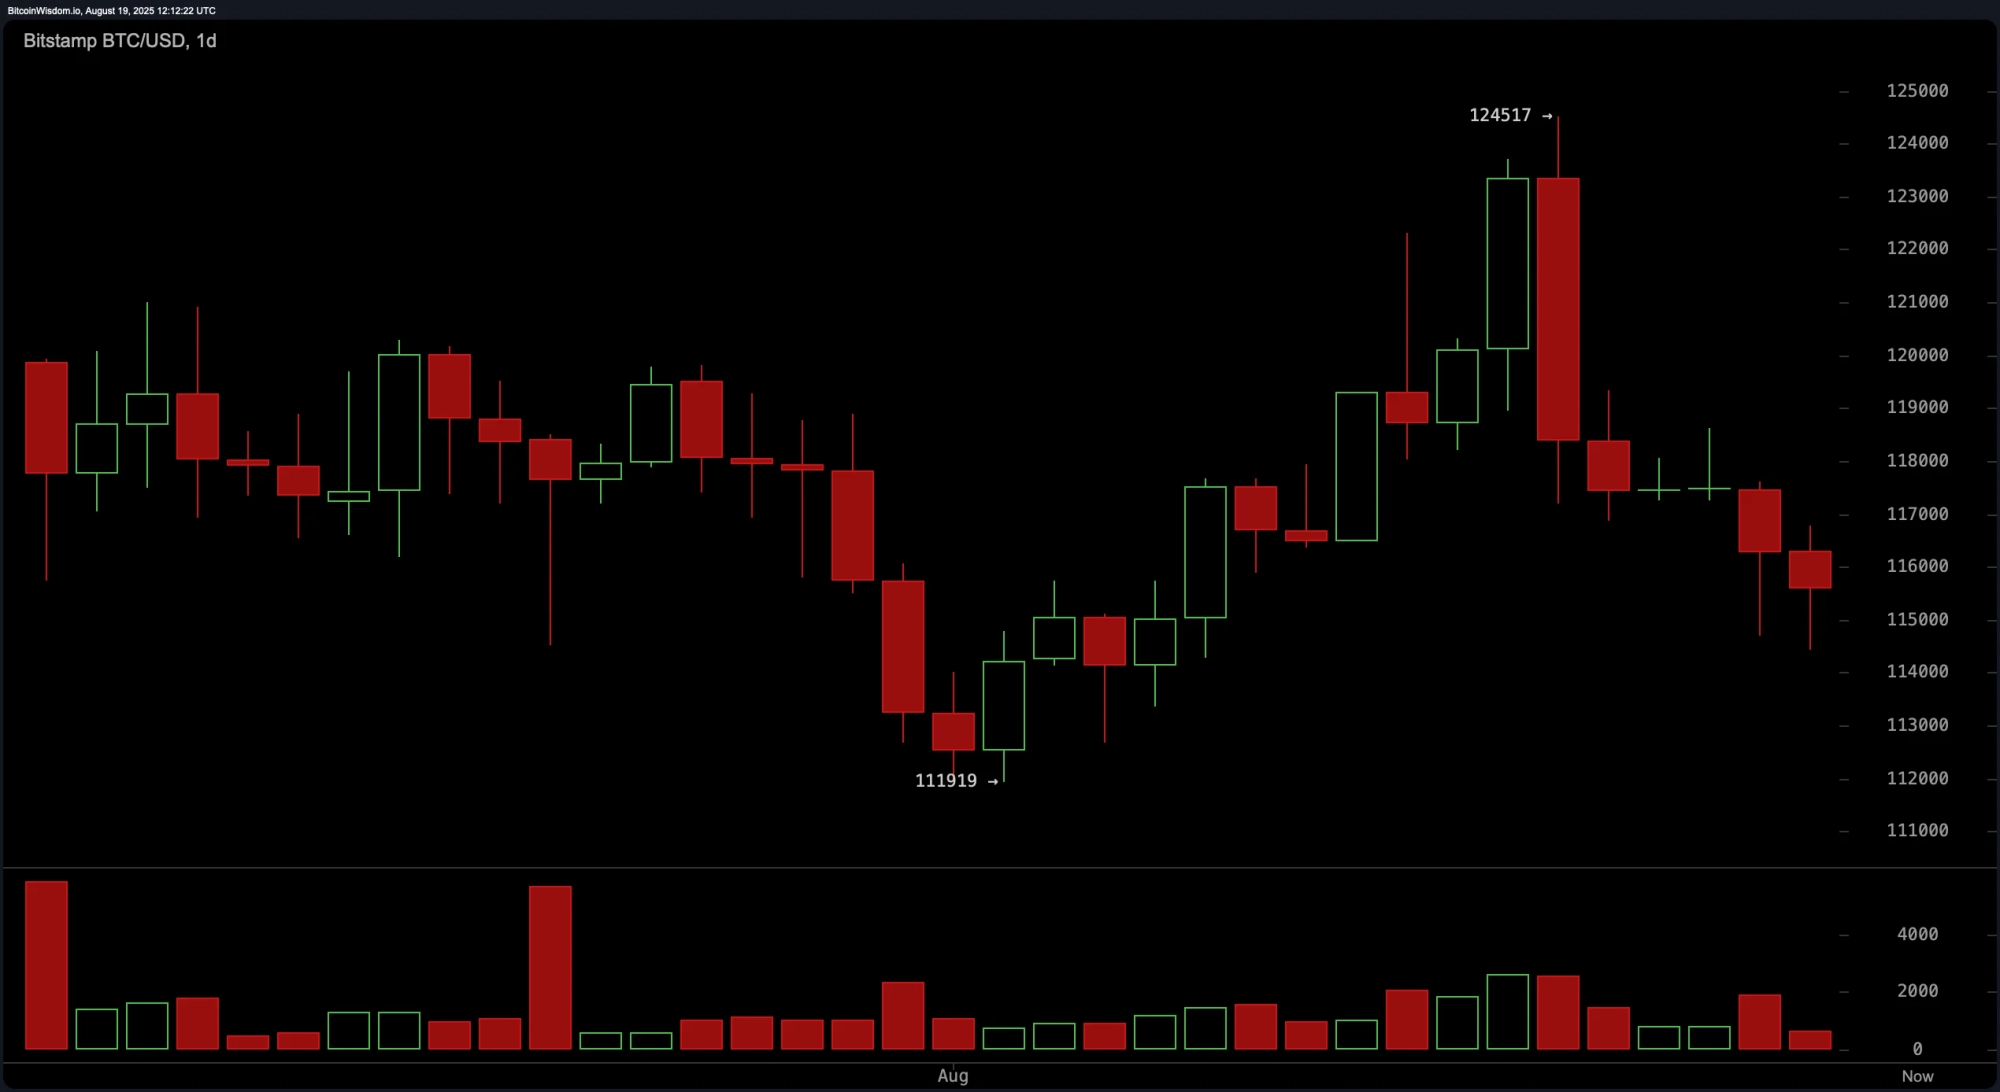 BTC/USD 1-day chart via Bitstamp on Aug. 19, 2025.
On the 4-hour chart, bitcoin continues to trade within a descending triangle or bear flag formation following a steep drop from $124,517 to $114,442. The recovery attempt has lacked momentum, with the price consolidating beneath resistance at $117,500. The prevailing pattern of lower highs reinforces a bearish bias in the medium term. If bitcoin fails to reclaim the $117,500 level on increased volume, the probability of a further breakdown grows, particularly below the $114,500 level, which could reexpose the $112,000 support zone.
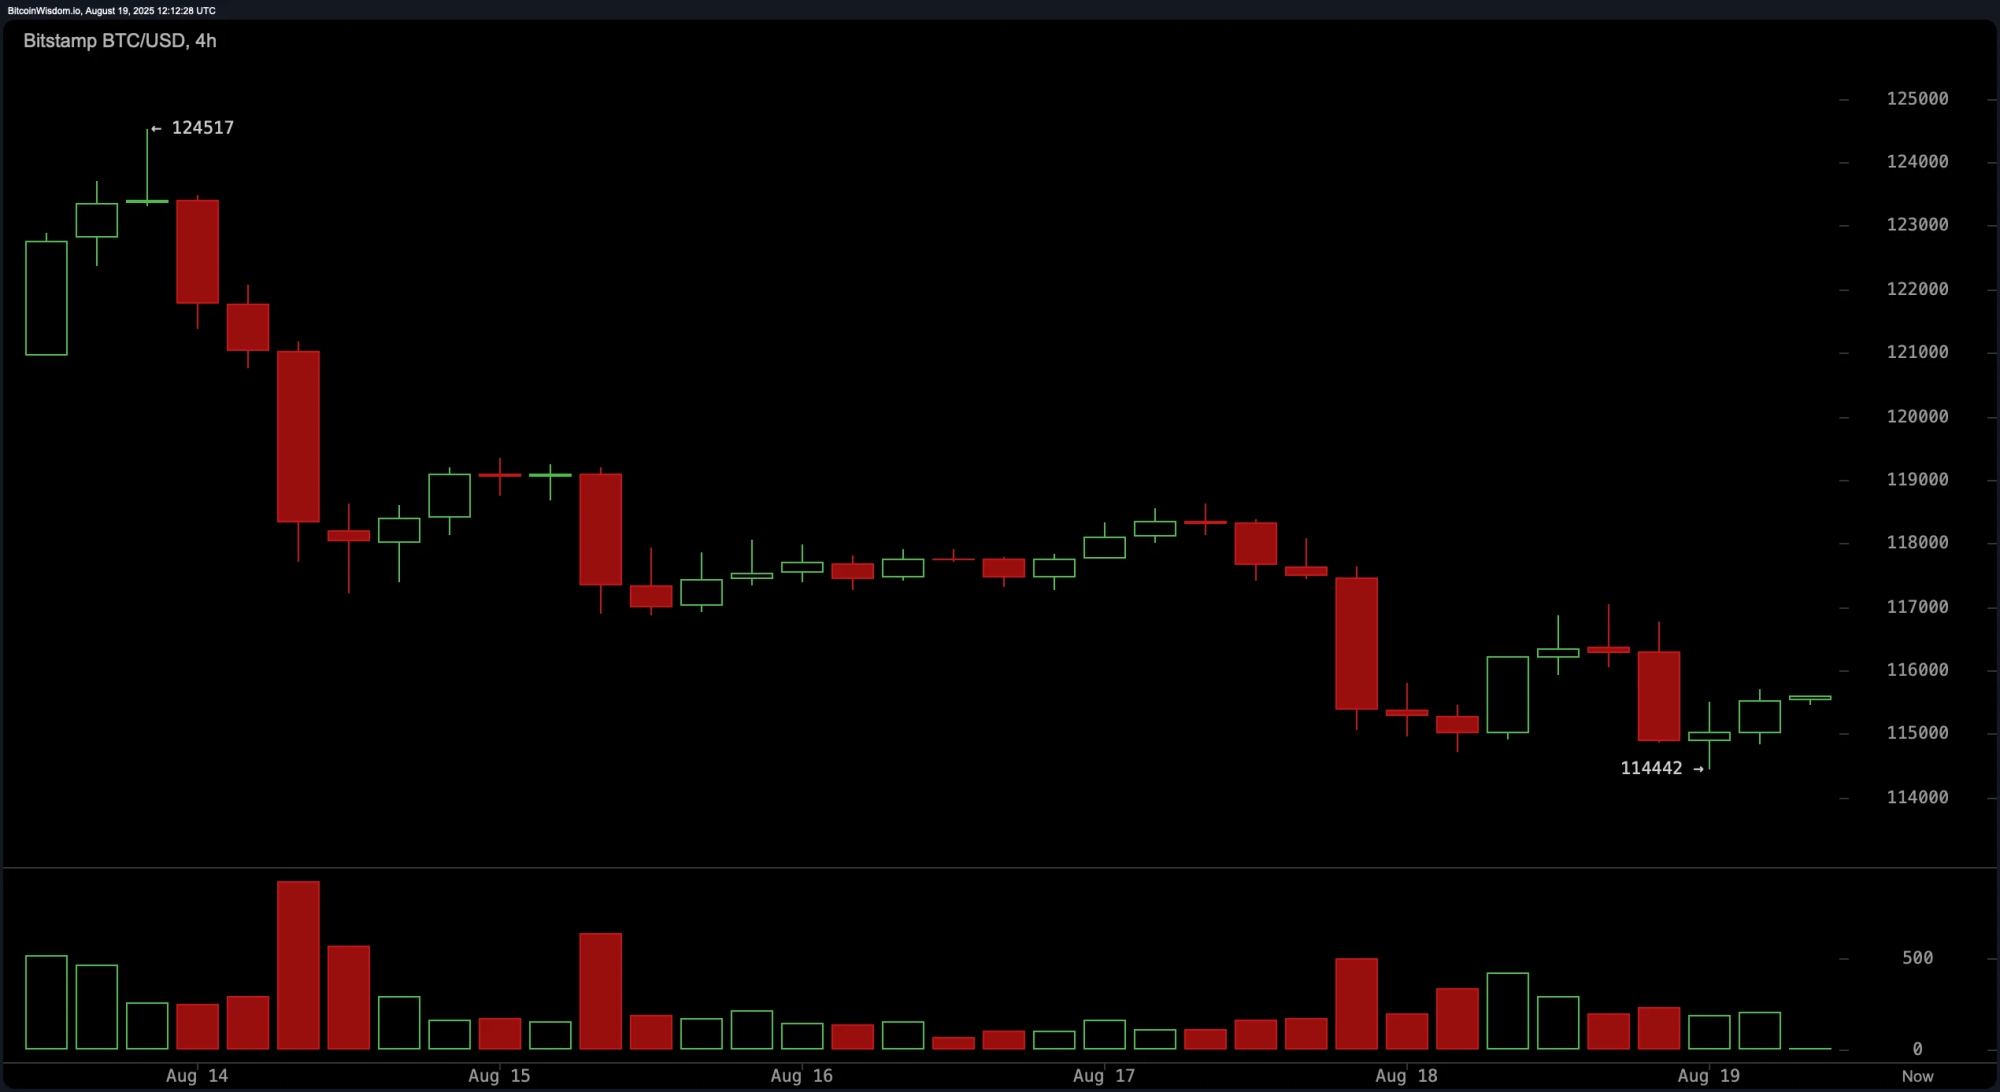 BTC/USD 4-hour chart via Bitstamp on Aug. 19, 2025.
Short-term price action on the 1-hour bitcoin chart is characterized by a gradual climb from the $114,442 base, forming higher lows. However, the weakening volume on green candles signals diminished buy-side pressure. For intraday traders, a break above $116,000 could prompt a short-term bounce toward $117,000$117,500, potentially driven by a short squeeze. Conversely, a drop below $114,500 would likely accelerate downside momentum and negate the current recovery structure.
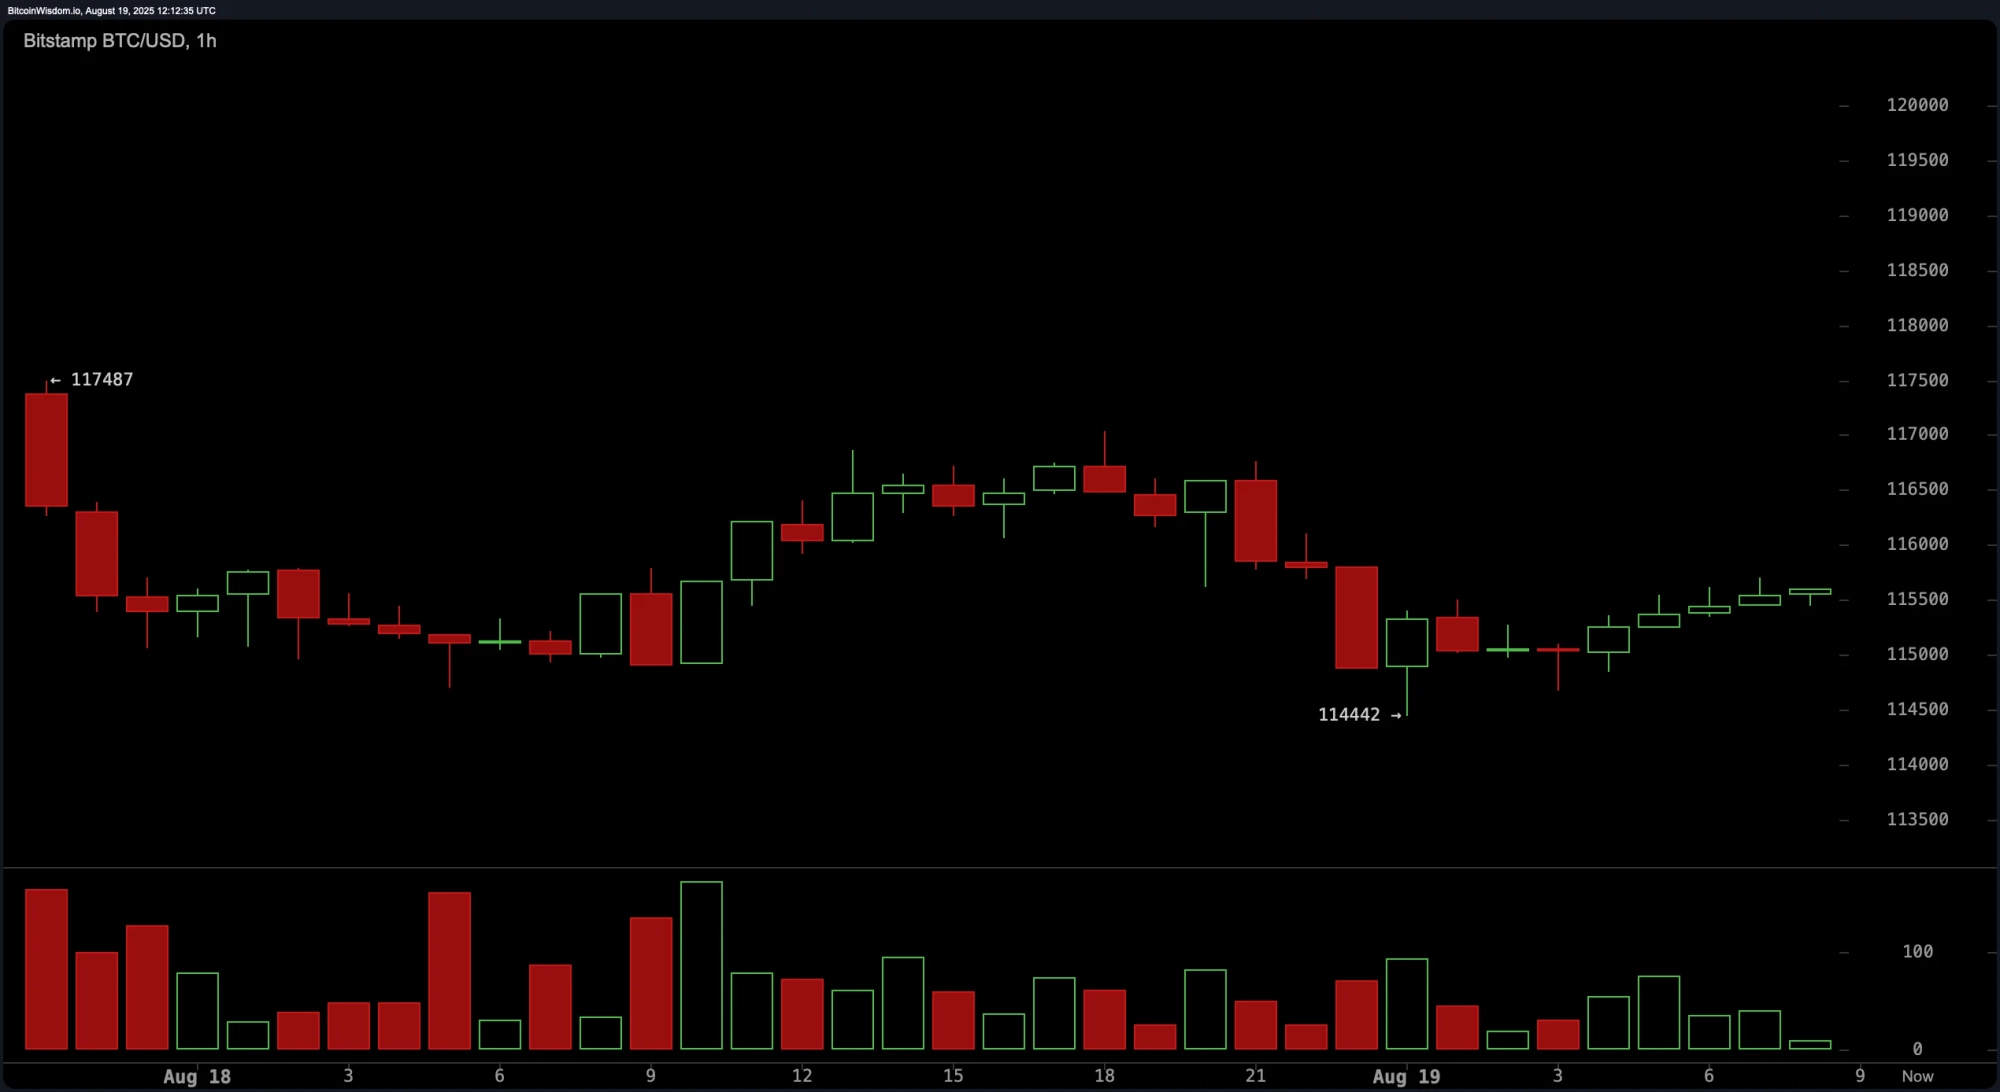 BTC/USD 1-hour chart via Bitstamp on Aug. 19, 2025.
Oscillator readings largely reflect indecision, with the relative strength index (RSI) at 46, stochastic at 30, commodity channel index (CCI) at -43, and average directional index (ADX) at 20 all suggesting a neutral stance. However, more reactive indicators such as the Awesome oscillator at -279, momentum at -980, and the moving average convergence divergence (MACD) at 413 indicate a negative signal, reinforcing short-term bearish pressure. This divergence between lagging and leading indicators highlights market fragility and the potential for sudden directional shifts.
Moving averages (MAs) paint a mixed picture. Shorter-term indicators including the 10-day and 20-day exponential moving averages (EMA), and their corresponding simple moving averages (SMA) all register bearish signals with prices lagging behind key trend levels. Conversely, longer-term EMAs and SMAs from the 50-day to 200-day range suggest underlying bullish strength, especially with the 200-day EMA at $103,098 and SMA at $100,416 offering foundational support. The convergence of short-term weakness and long-term strength underlines the importance of watching key pivot levels for potential inflection.
Bull Verdict:
For bulls, bitcoin must reclaim and hold above $118,000 with strong volume to confirm a potential trend reversal. This would invalidate the descending pattern and signal renewed buying strength, potentially opening the path back toward $120,000 and beyond. Until then, bullish positions remain speculative and should be approached with disciplined risk management.
Bear Verdict:
From a bearish standpoint, the structure across all timeframes remains unfavorable for sustained upward momentum. A breakdown below $114,500 would likely trigger further selling, targeting the $112,000 zone with potential for a deeper decline toward $108,000. Without a decisive reversal pattern, the prevailing trend favors continued downside pressure.